Article Text

Abstract
Background COPD is a heterogeneous disease, but there is little consensus on specific definitions for COPD subtypes. Unsupervised clustering offers the promise of ‘unbiased’ data-driven assessment of COPD heterogeneity. Multiple groups have identified COPD subtypes using cluster analysis, but there has been no systematic assessment of the reproducibility of these subtypes.
Objective We performed clustering analyses across 10 cohorts in North America and Europe in order to assess the reproducibility of (1) correlation patterns of key COPD-related clinical characteristics and (2) clustering results.
Methods We studied 17 146 individuals with COPD using identical methods and common COPD-related characteristics across cohorts (FEV1, FEV1/FVC, FVC, body mass index, Modified Medical Research Council score, asthma and cardiovascular comorbid disease). Correlation patterns between these clinical characteristics were assessed by principal components analysis (PCA). Cluster analysis was performed using k-medoids and hierarchical clustering, and concordance of clustering solutions was quantified with normalised mutual information (NMI), a metric that ranges from 0 to 1 with higher values indicating greater concordance.
Results The reproducibility of COPD clustering subtypes across studies was modest (median NMI range 0.17–0.43). For methods that excluded individuals that did not clearly belong to any cluster, agreement was better but still suboptimal (median NMI range 0.32–0.60). Continuous representations of COPD clinical characteristics derived from PCA were much more consistent across studies.
Conclusions Identical clustering analyses across multiple COPD cohorts showed modest reproducibility. COPD heterogeneity is better characterised by continuous disease traits coexisting in varying degrees within the same individual, rather than by mutually exclusive COPD subtypes.
- COPD epidemiology
Statistics from Altmetric.com
Key messages
What is the key question?
Are COPD subtypes identified through clustering algorithms reproducible in independent patient populations?
What is the bottom line?
COPD subtypes identified through clustering algorithms have modest reproducibility in the contexts studied, but continuous representations of COPD clinical characteristics are more reproducible.
Why read on?
This is the largest, multicohort study explicitly designed to assess the reproducibility of COPD subtypes, and it provides novel insights about the nature of clinical variability in COPD.
Introduction
COPD is characterised by significant disease heterogeneity,1 2 but there is little consensus regarding specific definitions for distinct COPD subtypes or phenotypes, terms which have been used interchangeably in the literature. Unsupervised clustering is intuitively appealing because it offers a data-driven, objective assessment of COPD heterogeneity, and several groups have used cluster analysis to identify COPD subtypes.3–9 However, a recent systematic review showed substantial differences in clustering results across studies,10 calling the reproducibility of these subtypes into question. Since clinical translation of COPD subtypes depends on reproducibility, this is a critical question for the clinical application of clustering-defined subtypes.
On the other hand, the conclusions that may be drawn from the previously mentioned systematic review are limited, since the wide variety of methods used in the different studies precluded quantitative meta-analysis and subject-level assessment of cluster reproducibility. By comparing average COPD-related characteristics across clusters, the authors identified two COPD subtypes that seemed to be reasonably replicable across studies. These subtypes were characterised by (1) severe airflow limitation, low body mass index (BMI) and poor health status and (2) moderate airflow limitation, high BMI and cardiovascular comorbidities.
To directly assess the reproducibility of COPD clustering subtypes, we performed uniform clustering analyses in 10 independent large cohorts of patients with COPD to which authors had access to individual patient data. These analysis results were shared across cohorts in order to (1) assess the similarity of correlation patterns between selected COPD clinical characteristics and (2) determine the reproducibility of unsupervised clustering across cohorts. These experiments demonstrate that for many important COPD-related clinical characteristics such as FEV1, emphysema and health-related quality of life, subjects with COPD are distributed along a continuous spectrum rather than being clustered into clearly distinct subgroups. As a result, clustering results are only modestly reproducible across independent studies, and continuous representations of COPD clinical variability are more consistent.
Methods
Subjects
The participating study populations were Clinical Identification of Phenotypes in COPD (CLIPCOPD),7 COPDGene,11 Evaluation of COPD Longitudinally to Identify Predictive Surrogate Endpoints (ECLIPSE),12 International collaborative effort on chronic obstructive lung disease: exacerbation risk index cohorts (ICE COLD ERIC),13 LifeLines,14 Lovelace,15 Leuven,16 Lung Health Study,17 the National Jewish Health (NJH) cohort and The Phenotype and Course of Chronic Obstructive Pulmonary Disease (PAC-COPD).18 Subjects included in this analysis were self-described Caucasian subjects meeting spirometric criteria for COPD (defined as postbronchodilator FEV1 and FVC ratio <0.7 with the exception of one cohort14 using prebronchodilator values). Institutional review board approval was obtained from the relevant participating academic centres for all study populations. Further details are provided in the online supplementary data.
Clustering features
Features used as inputs for the clustering analysis were selected based on availability within all 10 studies, excluding age and pack-years, which may be drivers of disease itself rather than manifestations. Accordingly, the clustering features finally selected were: FEV1 per cent of predicted, FVC per cent of predicted, FEV1/FVC ratio, BMI, Modified Medical Research Council (MMRC) dyspnoea score (0–4) and self-reported asthma and cardiovascular disease diagnosis. Additional details on clustering features are included in the online supplementary data.
Statistical and clustering analyses
All analyses were performed in R (V.3.1.0). To assess the similarity of the correlation patterns between variables, we first performed principal component analysis (PCA) in each cohort, and then we compared the feature loadings for each principal component (PC) across datasets.
To determine reproducibility of clustering solutions, we identified clusters in each cohort using hierarchical and k-medoids clustering according to the methods outlined by Horvath19 using a predetermined range of parameter settings, then we transferred these clustering solutions across cohorts by using supervised random forests predictive models (figure 1). The predictive accuracy of these models was quantified by out-of-bag cross-validation.

Overview of cluster generation, transfer and concordance assessment. For each cohort, 23 ‘source’ clustering solutions (S1 to S23) are generated (total of 230 solutions across the 10 cohorts). Each solution is transferred to the other cohorts via a predictive model (T1 to T23). Each solution is also labelled according to its parent cohort, thus source solution 1 from cohort 1=S1C1. Each cohort ultimately produces 230 cluster solutions (23 source solutions and 207 transferred solutions, which are ‘predicted into’ each cohort). The green, red and dark blue colours correspond to cluster results generated by a specific cluster method and set of parameters (eg, ‘k-medoids with k=2’). NMI, normalised mutual information.
We generated 23 clustering solutions per cohort in order to explore a wide range of possible solutions for the methods under study, for a total of 230 solutions. A distinct feature of the hierarchical clustering algorithm is that it identifies ‘poorly clustered’ subjects that are not sufficiently similar to other members in their assigned cluster.20 In subsequent analyses, the hierarchical clustering results were analysed with and without these ‘poorly clustered’ individuals.
We quantified the extent to which each ‘source’ clustering solution matched the clusters generated in the other cohorts using normalised mutual information (NMI), a measure of subject-level agreement.21 For each cohort, the best NMI solutions were considered the most reproducible cluster solutions, and the COPD-related characteristics of these clusters were described by means of descriptive statistics. We determined, based on the average characteristics of each cluster solution, whether any of the clusters resembled the previously mentioned frequently reported COPD subtypes (ie, the ‘severe airflow limitation, low BMI and poor health status’, and the ‘moderate airflow limitation, high BMI and cardiovascular comorbidities’).
A more comprehensive set of features was explored in two study cohorts, COPDGene and ECLIPSE (COPDGene-ECLIPSE substudy). These features included all of the features in the main study, as well as airway wall thickness (Pi10), quantitative emphysema (LAA950), number of self-reported respiratory exacerbations over the previous 12 months, chronic bronchitis symptoms and the Saint George’s Respiratory Questionnaire (SGRQ) total score. Additional details are included in the online supplementary data.
Results
Clinical characteristics of the study samples
The clinical characteristics of the analysed subjects from all 10 cohorts are shown in table 1.
Description of sociodemographic and clinical characteristics of 17 154 subjects with COPD by cohort
The number of subjects in each cohort ranged from 60 to 5198. Some studies included patients with COPD with a wide range of airflow limitation, whereas others had a predominance of severely affected or less severely affected subjects. Studies drew from populations in the USA and Northern and Southern Europe.
Correlation patterns and clustering importance of COPD clinical features
PCA demonstrated that the correlation pattern between variables was extremely similar across cohorts (figure 2), despite the fact that the distribution of variables differed across them (table 1). The majority of the variance was captured by the first three PCs in all participating cohorts (see online supplementary figure 1). In addition, when the data were visualised with multidimensional scaling, it resembled a continuous surface that tracked closely with spirometric disease severity in all study populations (see online supplementary figure 2). Thus, the correlation pattern and general structure of the data was highly consistent across cohorts, but the data were not clustered in distinct groups.

Loadings of input features (cluster variables) for the first four principal components (PC) in all cohorts. BMI. body mass index; CVD, cardiovascular disease; MMRC, Modified Medical Research Council.
As explained in the Methods section, prior to clustering, features were automatically weighted by the clustering procedure. The importance of each feature for determining cluster membership was very similar between datasets (figure 3). FEV1 per cent of predicted contributed most to the clustering solutions across all participating study populations, followed by FEV1/FVC and FVC. MMRC and BMI contributed to cluster solutions in some study populations but not others, and self-reported asthma and cardiovascular comorbidity did not contribute meaningfully to any clustering solutions.

Heat map of relative feature importance for clustering by cohort. Colours represent importance values generated by unsupervised random forests clustering. Higher values indicate that a given feature had a larger impact on the clustering results than other features in that dataset. Results for primary analysis in all 10 cohorts are shown in panel A. Results for the COPDGene and ECLIPSE substudy with more clustering features are shown in panel B.
Reproducibility of clustering results across cohorts
Figure 4 shows that, within each of the cohorts, the reproducibility of the k-medoid and hierarchical clustering results was modest (range of median NMI across 10 cohorts is 0.17–0.43 and maximum NMI is 0.29–0.72). However, when poorly classifiable subjects (identified by the hierarchical clustering method) were excluded, agreement across cohorts was higher (range of median NMI 0.32–0.60 and maximum NMI 0.61–1.0). The most highly reproducible cluster solutions varied greatly in terms of the number of identified clusters and cluster characteristics between cohorts. The clinical characteristics of these clusters are shown in online supplementary tables 2–11. The median accuracy of the supervised prediction models used to transfer cluster solutions between cohorts was 90.3% (IQR 82.3%–96.3%). We also examined whether these ‘best NMI’ solutions resembled the two clusters identified in the review by Pinto et al. Due to small cluster size, the NJH cohort solutions were not considered. Six of the nine best NMI solutions identified a cluster with severe airflow limitation and moderate MMRC dyspnoea scores (table 2), and three study populations identified a cluster characterised by increased BMI and cardiovascular comorbidities with mild-to-moderate airflow limitation (table 3). While these clusters appeared similar in their average characteristics, the average concordance of subject assignment to these clusters across different cohorts ranged from 50% to 86%.
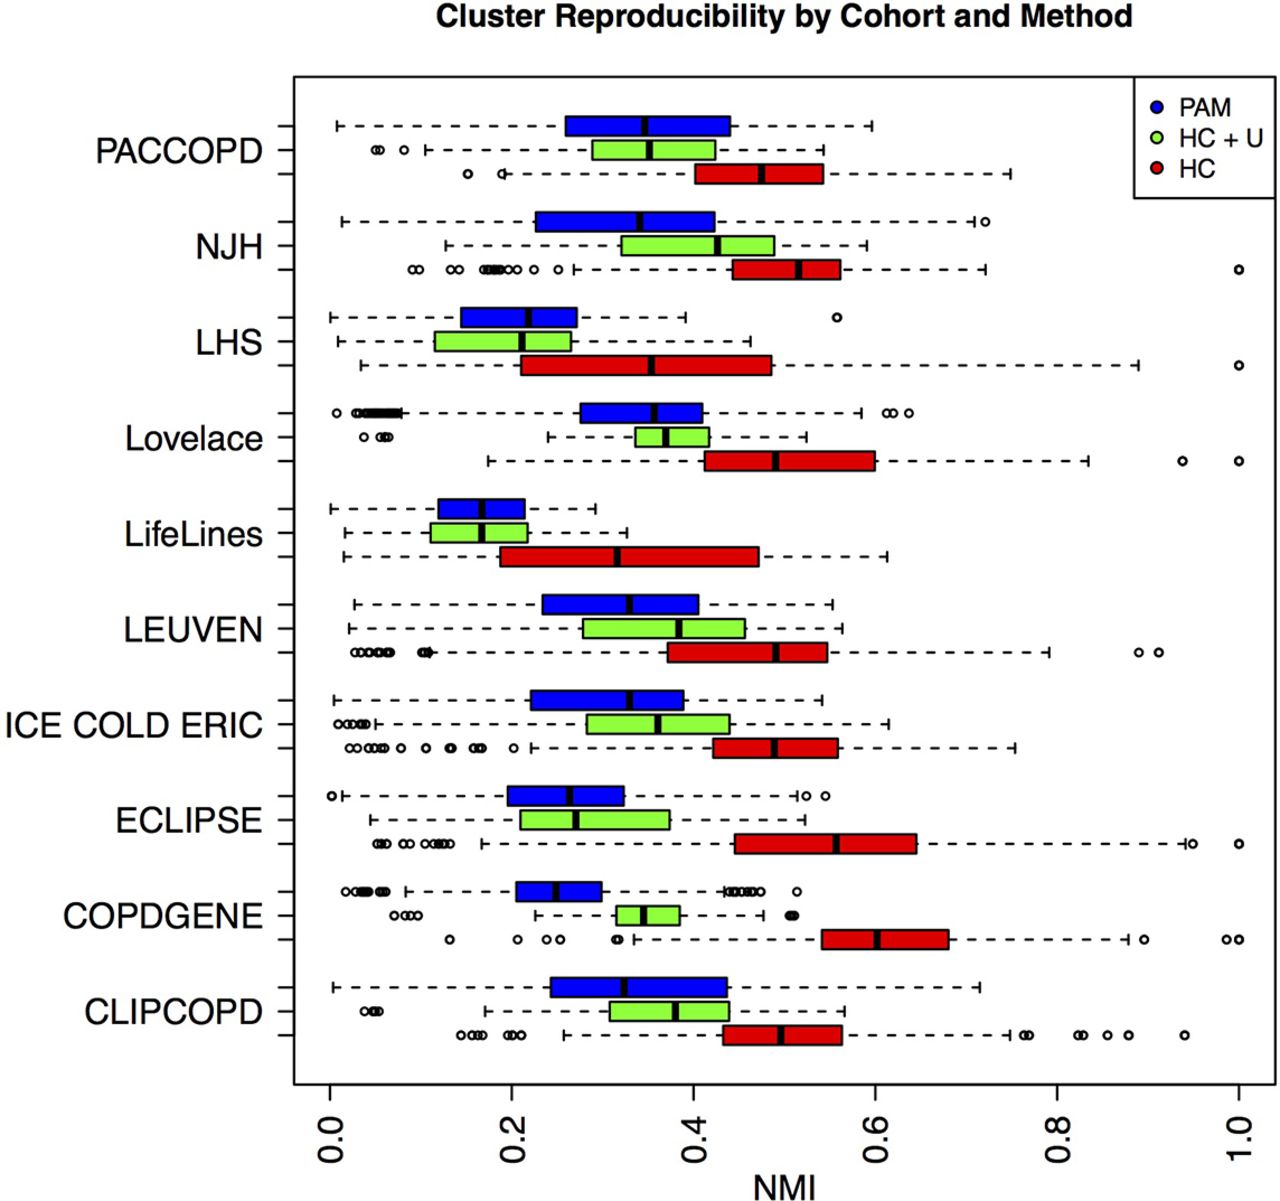
Reproducibility of different clustering methods across 10 cohorts. Distribution of normalised mutual information (NMI*) is shown for clustering with partitioning around medoids (PAM, in blue), hierarchical clustering including unclassified subjects (HC+U, in green) and hierarchical clustering excluding unclassified subjects (HC, in red).
Clinical characteristics of patients included in the clusters resembling the ‘severe airflow limitation, low BMI and poor health status’ subtype
Clinical characteristics of patients included in the clusters resembling the ‘moderate airflow limitation, high BMI and cardiovascular comorbidities’ subtype
COPDGene-ECLIPSE substudy with a more extensive set of COPD-related features
We considered the possibility that the modest reproducibility may be due to the limited set of variables common to all 10 cohorts. To observe the reproducibility of clustering on a more comprehensive set of variables, we applied the same clustering methods to a larger set of COPD-related clinical measures in subjects in spirometric Global Initiative for Chronic Obstructive Lung Disease (GOLD) stages 2–4 in the COPDGene and ECLIPSE studies. In addition to the seven features used in the main study, this analysis included measures of airway wall thickness (Pi10), quantitative emphysema from chest CT (LAA950), prior 12-month exacerbation history, chronic bronchitis and SGRQ score. The variable importance measures demonstrate that spirometric measures contribute the most to these cluster solutions, with the next most important measures being LAA950, MMRC and SGRQ score (figure 3). These analyses confirmed the findings from the main study, demonstrating modest reproducibility for the clusters that included all subjects and higher reproducibility for clustering approaches that allowed a proportion of subjects to be unclassified. PCA plots of these data also confirm that these data are distributed along a continuum rather than in discrete clusters (figure 5).

Principal components analysis plot of clustering variables used in COPDGene clustering. Visualisation of data by the first three principal components (PC) in the COPDGene clustering analysis with spirometric, chest CT imaging and clinical data.
We also considered the possibility that our observed modest cluster reproducibility may be due to differences in the underlying data distributions between cohorts. To address this question, we performed a clustering analysis in the COPDGene-ECLIPSE substudy limited to subjects in GOLD spirometric stage 2 only. The reproducibility of these clustering solutions is comparable to our other experiments (see online supplementary figure 3).
Because some of the solutions allowing for unclassified subjects did demonstrate high reproducibility, we examined the characteristics of these clusters in both COPDGene and ECLIPSE. The COPDGene analysis identified three clusters that corresponded to a healthier group (higher FEV1 % predicted, less emphysema and less airway wall thickening), an emphysema-predominant group and an airway predominant group (see online supplementary table 12). However, the proportion of unclustered subjects was high (86% of all subjects). The most reproducible clustering solution in ECLIPSE identified six clusters, and also demonstrated a high rate of unclassified subjects (52%).
Discussion
This study is the first investigation of the reproducibility of COPD clustering results across multiple independent cohorts, and it demonstrates that (1) COPD subtypes identified through clustering show only modest reproducibility and (2) the variable manifestations of COPD are better represented by continuous traits, such as airflow limitation or quantitative emphysema, which can coexist to varying degrees within the same individual, rather than categorisations of patients in mutually exclusive COPD subtypes/phenotypes. These findings have a number of implications for the future study of COPD subtypes. First, the concept of continuous representations of COPD, similar to the concept of ‘treatable traits’,22 is a useful alternative to clusters that highlights distinct aspects of COPD, while allowing for the fact that these treatable traits may be present to varying degrees in different subjects. Second, for some sets of variables, standard data-driven clustering methods may not demonstrate levels of reproducibility appropriate for clinical use.
Interpretation of results
The clustering data used in this study capture many important aspects of COPD pathology and have been used in previous attempts to classify COPD.3 6 7 22 23 The modest reproducibility of clustering solutions can be explained by the fact that these data do not have strong clustering structure and are better characterised by a continuum of disease severity. However, this observation applies only to the limited set of COPD clinical characteristics used in this study. It is possible that other COPD-related characteristics may lead to more reproducible clusters.
Despite modest clustering reproducibility, certain clusters tend to recur across multiple studies. Clustering often identifies a ‘severe COPD’ cluster with low FEV1, low BMI and dyspnoea. The COPDGene-ECLIPSE substudy confirms that this cluster also has extensive CT emphysema. The other commonly occurring cluster is an ‘airway-predominant cluster’ characterised by moderately impaired FEV1 and elevated BMI. In the COPDGene-ECLIPSE substudy, this group also had thickened airway walls and relatively little CT emphysema. These two clusters resemble the clusters identified by Pinto et al, providing additional support to the concept of ‘emphysema-predominant’ and ‘airway-predominant’ COPD.
While our results demonstrate limitations of clustering, they do not indicate that phenotypic differences between subjects with COPD are small or negligible. On the contrary, our data confirm that COPD encompasses a wide range of clinical presentations, because the average characteristics of clusters were quite different. It is also important to note that (1) reproducibility can vary by subtype and (2) many subtype definitions are reproducible in the sense that predictive models can be used to identify groups of subjects in other datasets with similar characteristics. Thus, our findings demonstrate that clustering, as a means to define subtypes in an unbiased manner, is only modestly reproducible for a set of variables that includes many of the most commonly used phenotypic measures of COPD.
Implications of findings
This study has a number of important implications for the future study of COPD subtypes. First, it demonstrates that reproducibility of clustering results cannot be assumed across independent cohorts. Second, it demonstrates that continuous representations of COPD clinical variability are an alternative approach to characterising COPD heterogeneity that are better suited to the continuous nature of many key COPD-related phenotypic measures. These continuous representations are similar to the concept of ‘treatable traits’ that has been previously proposed as a strategy to improve the management and prognosis of patient with COPD.22 Unlike clusters, treatable traits are not mutually exclusive since any given patient can manifest more than one ‘phenotypic’ trait. For instance, for two patients with the same amount of airflow limitation and emphysema, one may have bronchiectasis and the other may not, and both of them may or may not have pulmonary hypertension. Third, it may be useful to use differences in clinically relevant outcomes such as risk of exacerbation, mortality or FEV1 decline to define group boundaries and COPD subtypes. This entails a shift in the general conception of COPD subtypes, because it implies that there may be multiple distinct sets of subtypes that depend on the specific clinical outcome of interest. However, the concept of treatment-specific or outcome-specific subtypes is already well-established in clinical practice (ie, roflumilast for subjects with COPD and chronic bronchitis to reduce exacerbations). Fourth, the definition of COPD subtypes may benefit from the identification of novel features, including genomic or proteomic features, which more effectively identify distinct COPD subtypes. Fifth, clustering methods that identify a ‘core’ of clustered individuals are more reproducible than methods that assume that all subjects can be classified. Finally, clustering can be useful for data exploration, as long as its potential limitations regarding reproducibility are recognised.
Strengths and limitations
This study has a number of strengths. As noted by Pinto et al, previous efforts to address cluster reproducibility in COPD have been limited by extensive heterogeneity in methods between studies.10 Our collaborative effort addressed this issue by performing identical clustering analyses across multiple cohorts, resulting in insights that would have been difficult to obtain from studying these cohorts individually. We used multiple clustering methods and explored a wide range of clustering parameters. To our knowledge, this is the largest and most comprehensive replication effort for cluster-based complex disease subtype identification.
This study also has important limitations. Because the variables used in the primary analysis were limited to those available in all participating study populations, this set of features does not fully capture the phenotypic spectrum of COPD. However, the clustering data used in this study capture many important aspects of COPD pathology and have been used in previous attempts to classify COPD.3 6 7 23 24 In addition, when a more comprehensive set of variables was assessed in the COPDGene-ECLIPSE substudy, the level of reproducibility was still modest. Second, while all studies included subjects with FEV1/FVC <0.7, there were still differences in the distribution of variables, enrolment criteria and subject selection between studies. This variability may have limited the concordance of clustering solutions across studies. However, to address this concern, we performed clustering for an even more well-defined group of only GOLD 2 subjects in COPDGene and ECLIPSE, and the results of this analysis were consistent with the overall study results, suggesting that incomplete sampling was not likely to be a major driver of these results. Third, certain variables related to medical history, such as asthma or cardiovascular disease, are ascertained primarily by self-report and may not be uniform across studies. This would limit the ability to identify potential clusters related specifically to those variables. Fourth, our analysis of clustering methods was not exhaustive. It was outside the scope of this effort to exhaustively survey the performance of all available clustering methods. Fifth, for those methods that allowed for ‘unclustered’ subjects, the unclustered rate was quite high for the best NMI solutions in some cohorts. This likely reflects the poor separability of the underlying data rather than a shortcoming of the specific clustering method, since this method has been applied successfully in other scenarios.20 Finally, non-smoking subjects with COPD are under-represented in these cohorts, and characterisation of heterogeneity in non-smoking COPD requires further study.25
Conclusions
This study of the replicability of clustering-defined COPD subtypes across multiple international cohorts found that COPD heterogeneity is best represented by continuous traits (such as airflow limitation or quantitative emphysema) coexisting in varying degrees within the same individual, rather than by mutually exclusive COPD subtypes/phenotypes. This is an important perspective to inform future efforts to characterise COPD heterogeneity.
References
Footnotes
Contributors Conception and design: PJC, JGA; acquisition, analysis and/or interpretation: PJC, MB, HP, JF, MP, HMB, JMV, MAP, EW, DL, WJ, MHC, KB, SR, MPB, JDC, YT, EKS; drafting the manuscript for important intellectual content: all authors.
Funding CLIPCOPD was funded by the Ministry of the University and the Ministry of Health of Italy. The COPDGene study (NCT00608764) was supported by Award Number R01HL089897 (JDC), R01HL089856 (EKS) and R01 HL075478 (EKS) from the National Heart, Lung, and Blood Institute. The COPDGene project is also supported by the COPD Foundation through contributions made to an Industry Advisory Board comprising AstraZeneca, Boehringer-Ingelheim, Novartis, Pfizer, Siemens and Sunovion. This work was supported by the US National Institutes of Health (NIH) grants R01 HL124233 and R01 HL126596 (PJC), R01 HL113264 and the Alpha-1 Foundation (MHC). The content is solely the responsibility of the authors and does not necessarily represent the official views of the National Heart, Lung, And Blood Institute or the National Institutes of Health. The ECLIPSE study was funded by GSK (NCT00292552). The ICE COLD ERIC study was supported by the Swiss National Science Foundation (grant 3233B0/115216/1), Dutch Asthma Foundation (grant 3.4.07.045) and Zurich Lung League (unrestricted grant). LifeLines has been funded by a number of public sources, notably the Dutch Government, The Netherlands Organization of Scientific Research NWO, the Northern Netherlands Collaboration of Provinces (SNN), the European fund for regional development, Dutch Ministry of Economic Affairs, Pieken in de Delta, Provinces of Groningen and Drenthe, the Target project, BBMRI-NL, the University of Groningen and the University Medical Center Groningen, The Netherlands. The Lovelace Smokers Cohort was funded by the State of New Mexico (appropriation from the Tobacco Settlement Fund) and by institutional funds. The Lung Health Study was supported by GENEVA (U01HG004738) and by contract NIH/N01-HR-46002. The NJH cohort was supported by National Jewish Health internal funds. The PAC-COPD study was supported by grants from the Fondo de Investigación Sanitaria (grants PI020541, PI052486, PI052302 and PI060684), Ministry of Health, Madrid, Spain; the Agència d’ Avaluació de Tecnologia i Recerca Mèdiques (grant 035/20/02), Catalonia Government, Barcelona, Spain; the Spanish Society of Pneumology and Thoracic Surgery (grant 2002/137); the Catalan Foundation of Pneumology (grant 2003 Beca Marià Ravà); the Red Respira (grant C03/11); the Red de Centros de Investigación Cooperativa en Epidemiología y SaludPública (grant C03/09); the Fundació La Marató de TV3 (grant 041110) and NovartisFarmacèutica, Barcelona, Spain. The CIBERESP is funded by the Instituto de SaludCarlos III, Ministry of Health, Madrid, Spain.
Competing interests Over the past 3 years, PJC has received research support and consulting fees from GSK. Other authors have no competing interests to declare.
Ethics approval All participating institutional review boards.
Provenance and peer review Not commissioned; externally peer reviewed.
Linked Articles
- Airwaves