Article Text

Abstract
Objectives Timely detection of gastric cancer (GC) and the related precancerous lesions could provide a tool for decreasing both cancer mortality and incidence.
Design 968 breath samples were collected from 484 patients (including 99 with GC) for two different analyses. The first sample was analysed by gas chromatography linked to mass spectrometry (GCMS) while applying t test with multiple corrections (p value<0.017); the second by cross-reactive nanoarrays combined with pattern recognition. For the latter, 70% of the samples were randomly selected and used in the training set while the remaining 30% constituted the validation set. The operative link on gastric intestinal metaplasia (OLGIM) assessment staging system was used to stratify the presence/absence and risk level of precancerous lesions. Patients with OLGIM stages III–IV were considered to be at high risk.
Results According to the GCMS results, patients with cancer as well as those at high risk had distinctive breath-print compositions. Eight significant volatile organic compounds (p value<0.017) were detected in exhaled breath in the different comparisons. The nanoarray analysis made it possible to discriminate between the patients with GC and the control group (OLGIM 0–IV) with 73% sensitivity, 98% specificity and 92% accuracy. The classification sensitivity, specificity, and accuracy between the subgroups was as follows: GC versus OLGIM 0–II—97%, 84% and 87%; GC versus OLGIM III–IV—93%, 80% and 90%; but OLGIM I–II versus OLGIM III–IV and dysplasia combined—83%, 60% and 61%, respectively.
Conclusions Nanoarray analysis could provide the missing non-invasive screening tool for GC and related precancerous lesions as well as for surveillance of the latter.
Trial registration number Clinical Trials.gov number, NCT01420588 (3/11/2013).
- GASTRIC PRE-CANCER
- GASTRIC CANCER
Statistics from Altmetric.com
Significance of this study
What is already known on this subject?
Most patients with gastric cancer in Western countries are diagnosed at advanced stages when the survival chances are relatively poor.
Detection of precancerous lesions would allow surveillance to be performed, making early detection of the transformation to cancer possible.
Highly accurate non-invasive screening methods for gastric cancer and related precancerous lesions are lacking.
What are the new findings?
Volatile organic compound marker detection-based nanoarray technology allows gastric cancer to be detected with high accuracy in a Caucasian population.
The technology also allows high-risk precancerous lesions to be detected via exhaled breath.
The volatile organic compound breath marker detection approach could reveal the presence or absence of lesions irrespective of confounding factors such as Helicobacter pylori infection, smoking and others.
How might it impact on clinical practice in the foreseeable future?
Volatile organic compound marker testing has potential in screening for gastric cancer and for the identification and surveillance of precancerous lesions.
In view of our data and of other recently published research in the field, volatile marker testing could be useful for simultaneous detection of several diseases and lesions, including those affecting the stomach.
Introduction
The future of cancer prevention relies on timely recognition and surveillance of precancerous lesions as well as early detection of the cancer, making higher survival rates and lower healthcare costs per patient achievable.1 ,2 Currently, effective screening or prevention methods are available only for a few cancers, and even those could be improved.3 Recognition of the disease at the precancerous stage could lead to reductions in the incidence of, and mortality from, the particular cancer. This claim is exemplified by cervical cancer, where management of screen-detected lesions has resulted in an 80% decrease of incidence in many regions.4 In the case of gastric cancer (GC), nationwide screening is available only in Japan and Korea using methods (X-ray, upper endoscopy) that would not be cost-effective or acceptable outside Asia, primarily because the incidence of the disease is lower. However, globally there are many other areas with high burdens of the disease.5
The carcinogenesis of intestinal-type GC is an example of a malignant disease with a well-described precancerous lesion cascade (atrophy, intestinal metaplasia (IM), dysplasia), though only a minor proportion of lesions (with the exception of dysplasia) progress to cancer.6 It is therefore important to characterise and classify the lesions correctly and to stratify the risk of cancer development so that surveillance intervals and methods can be properly determined.7 Nevertheless, there is no perfect screening tool for GC and the related precancerous lesions that could be applied generally in areas with different GC incidences around the globe.
An emerging approach for detecting lesions and classifying them according to risk relies on volatile organic compounds (VOCs) linked to the disease conditions and appearing in exhaled breath.8–10 This approach makes detection non-invasive and painless, with no undesirable side effects, and satisfies the need for detection accuracy in different fields of medicine.11–13 In the same spirit, we and others have provided proof-of-concept evidence that the breath test could serve to discriminate between GC and constituent control groups.14–18 Nevertheless, these studies were limited by small cohort sizes and none of them considered the detection and classification of precancerous lesions. In this paper, we examine the possibility of detecting and classifying such lesions via breath samples, potentially providing a new tool for screening, timely identification and surveillance of patients at increased risk for developing GC.
Patients and methods
Patients and groups
Four hundred and eighty-four patients were recruited at the Riga East University Hospital in Latvia. All the patients signed a consent form upon enrolment. Table 1 summarises the main clinical characteristics of all the patients tested.
Clinical characteristics of all patients tested in the current study
Patients with GC (morphologically confirmed adenocarcinomas) were enrolled prior to surgery. No chemotherapy or radiation therapy was allowed prior to enrolment. Patients with non-malignant diseases were enrolled prior to upper endoscopy. In this category, a peptic ulcer disease (PUD) group included patients with an active ulcer or a fresh scar, confirmed by endoscopy (patients with malignant ulcers or dysplasia were excluded from this group). Patients with old scars or deformation of the gastroduodenal zone without evidence of fresh ulceration were not included in the PUD group.
Five biopsies corresponding to the updated Sydney system were obtained and routinely stained with H&E and modified Giemsa. The operative link on gastric intestinal metaplasia (OLGIM) assessment staging system19 was used to stratify the presence/absence and the stage of precancerous lesions. The staging system considers the presence and stage of IM in the corpus and antral part of the stomach (an incisura biopsy is analysed together with antral biopsies). Patients with confirmed dysplasia in the stomach mucosa were included in the high-risk lesion group when the low-risk and high-risk lesions were compared, but they were excluded from other analyses because they formed too small group (n=7) for valid statistics. Patients with PUD were not included in the OLGIM group analysis because we considered that inflammation and tissue injury consequent on ulcers could result in a different breath print from those without active ulceration. The slides were read and confirmed by expert pathologists.
Patients who had undergone stomach surgery in the past were excluded from the study. Helicobacter pylori status was determined using IgG group antibodies (Biohit, Oyj., Finland; ELISA test-system with positive test result cut-off ≥30 enzyme immunoassay units (EIU)); for patients undergoing upper endoscopy, histological confirmation in Giemsa-stained slides was required. Current smokers were included in the groups of ‘smoking’ individuals. Those having more than one drink (2–4 units) per week were considered ‘alcohol users’.
Collection and analysis of breath samples
Exhaled breath samples were collected in a precise and accurate manner as described elsewhere.10 ,20 All participants fasted for 12 h and refrained from smoking for at least 3 h prior to sampling. Detailed information about breath collection, preparation and storage is given in the online supplementary information, section S1. Briefly, two breath samples were collected from each volunteer for characterisation and identification using two different methods (see figure 1). The first method uses gas chromatography linked to mass spectrometry (GCMS) to identify and quantify the various breath VOCs in each group studied (see online supplementary information, section S2, for more details). The second method deploys cross-reactive nanoarrays in combination with pattern recognition methods. This approach provides collective VOC patterns rather than identification and quantification of specific VOCs. It does not require expensive equipment so it has realistic potential for fast, cost-effective, high-throughput GC diagnostics in the future.21 For more details about the concept and experimental aspects of the nanoarray approach, see online supplementary information, section S3. Briefly, on the sensor nanoarray, each sensor is composed of gold nanoparticles (GNPs) and single-wall carbon nanotubes (SWCNTs) covered with different organic films (ligands). The VOCs are adsorbed by the ligand component, and the GNP and the SWCNT (inorganic nanomaterials) generate electrical conductivity.

Two approaches to the analysis of volatile organic compounds from exhaled breath: (A) gas chromatography linked to mass spectrometry (GCMS) and (B) the nanoarray (sensor) method. GC, gastric cancer; GNP/CNT, gold nanoparticles/carbon nanotubes.
The nanoarray signals were analysed by randomly picking 70% of the samples to build the discriminant factor analysis (DFA) model as a training set, and then using the remaining 30% of the samples for blinded analysis, viz. a validation test. The cut-off values (based on the Youden's index) were determined by the receiver operating characteristic (ROC) curve analysis based on the training set results (detailed information is available in the supplementary information, section 3). The main DFA model that distinguished GC from the control group (OLGIM 0–IV) was used to test for the potential confounding factors. For this, all the samples were grouped according to H pylori positivity, gender, age (below or above 61 years), smoking, alcohol use and proton pump inhibitor (PPI) use 1 month prior to enrolment, and the model was plotted onto the divided groups. Area under the curve (AUC) in the ROC analysis was used to characterise the impact of the potential confounding factors.
A t test was used to identify significant differences in VOCs between groups. The normal distribution patterns of the significant VOCs were confirmed using SAS JMP, V.10.0 (SAS Institute, Cary, North Carolina, USA; 1989–2005). The p value was set at 0.017 (0.05/3) after Bonferroni correction with three multiple corrections. To test the reproducibility of the breath collection procedure, several experiments were conducted (see online supplementary information, section S4.1). The effect of the hospital's room air on the collected breath samples was found to be negligible (see online supplementary information, section S4.2). Altogether, our control experiments indicate that the breath collection process was not affected by place and/or time variations.
Results
Altogether, 484 patients of Caucasian origin were enrolled; of these, 99 were in the GC group (36 at stages I–II, 59 at stages III–IV; four cases lacked exact staging data). The PUD group included 53 patients (one of these had OLGIM III and another had OLGIM IV mucosal lesions), and the dysplasia group seven patients, all of whom presented with low-grade dysplasia. The remaining 325 cases had the following distribution over the different OLGIM stages: 155—OLGIM 0, 136—OLGIM I–II and 34—OLGIM III–IV. More detailed group characteristics are given in table 1.
Chemical analysis
GCMS revealed 130 different VOCs in the breath samples studied (see online supplementary table S2). However, only eight of these VOCs differed in statistically significant manner between the various groups with p values <0.017 (see table 2). These VOCs were 2-propenenitrile (VOC 1), furfural (VOC 2), 2-butoxy-ethanol (VOC 3), hexadecane (VOC 4), 4-methyloctane (VOC 5), 1,2,3-tri-methylbenzene (VOC 6), α-methyl-styrene (VOC 7) and 2-butanone (VOC 8) (see table 2). Seven of them appeared in the OLGIM group(s) at significantly lower concentrations than in the GC group (see table 2). Figure 2 presents a colour map of the eight significant VOCs in the different groups tested. It demonstrates that no single VOC could discriminate among the groups. Nevertheless, the breath print of each group examined, meaning the combination of the eight statistically validated VOCs (the columns in figure 2), demonstrated clear differences between the control (OLGIM 0–IV) and the GC group. VOC 1, VOC 4, VOC 6 and VOC 8 differed significantly between the OLGIM and GC groups. However, only VOC 6 exhibited significant differences among the OLGIM groups (see figure 2). VOC 1, VOC 5 and VOC 6 differed among the OLGIM groups but mainly between OLGIM 0 and OLGIM III–IV (see figure 2). VOC 2 and VOC 3 exhibited minor differences between the different OLGIM and GC groups. Detailed information on the power to discriminate among the various (sub-) groups is evident in table 2. These findings demonstrate that combinations of VOC 1 to VOC 8 at different compositions (or ratios between concentrations) compose the breath print of each OLGIM (sub-) group.
Summary of the structure and concentration of the eight statistically validated volatile organic compounds (VOCs) of 130 VOC originally obtained from the exhaled breath samples in various study groups, and the binary comparisons between the tested groups showing significant p values (<0.017)

A colour plot of the statistically significant volatile organic compounds (VOCs) identified by gas chromatography mass spectrometry in the studied groups. The scale bar shows the VOC concentration (in ppb) by each representative colour. GC, gastric cancer; GC I–IV, gastric cancer, stages I–IV; GC I–II, gastric cancer, stages I–II; GC III–IV, gastric cancer, stages III–IV; OLGIM, operative link on gastric intestinal metaplasia; OLGIM 0–IV, OLGIM stages 0–IV (included patients without and with any stage of intestinal metaplasia); OLGIM 0, patients lacking signs of intestinal metaplasia; OLGIM I–II, patients with OLGIM stages I–II; OLGIM III–IV, patients with OLGIM stages III–IV; PUD, peptic ulcer disease; VOC 1, 2-propenenitrile; VOC 2, furfural; VOC 3, 2-butoxy-ethanol; VOC 4, hexadecane; VOC 5, 4-methyl octane; VOC 6, 1,2,3-trimethylbenzene; VOC 7, methylstyrene, VOC 8, 2-butanone.
Nanoarray analysis
DFA models were built to distinguish between the tested groups in binary comparisons; the results are presented in table 3. Plotting of the test results between different comparisons in the training set is demonstrated by the first two bars on the images to the left (figure 3A, C, E, G, I). Based on these results the ROC curves were constructed (figure 3B, D, F, H, J), and cut-off values (Youden's index) were driven (horizontal line in figure 3A, C, E, G, I). The following AUC results for the comparisons were obtained in the training set: GC versus control (OLGIM 0–IV)—92%, GC versus OLGIM 0–II—95%, GC versus OLGIM III–IV—98%, OLGIM III–IV and dysplasia combined versus OLGIM 0–II—80%, OLGIM III–IV versus OLGIM 0—76%.
Classification success of the discriminant factor analysis (DFA) models for the sensor nanoarray analysis

Discriminant factor analysis models (on the left) and the corresponding receiver operating characteristic (ROC) curves (on the right) for different comparisons of the sensors nanoarray measurements. The first two bars on the left images represent the results of the comparators from the training set sample, while the subsequent four bars (true-positive (TP), false-negative (FN), true-negative (TN) and false-positive (FP)) represent validation set samples. The horizontal line corresponds to the cut-off value. The images to the right represent ROC analysis derived exclusively from the training set samples for cut-off value determination. The following comparisons are presented: (A and B) GC vs control (OLGIM 0–IV); (C and D) GC vs OLGIM 0–II; (E and F) GC vs OLGIM III–IV; (G and H) OLGIM III–IV and low-grade dysplasia combined vs OLGIM 0–II; (I and J) OLGIM III–IV vs OLGIM 0. AUC, area under curve; CV1, canonical variable; OLGIM, operative link on gastric intestinal metaplasia.
Further application of the obtained cut-off values from the training set analysis to the blinded (validation) sample set allowed estimating the performance indicators being reported in the current paper (see figure 3 and table 3). Plotting of the validation set results (true-positive, false-negative, true-negative and false-positive) is demonstrated by the four last bars on the images to the left (figure 3A, C, E, G, I), while the performance indicators of the method for different comparators are presented in table 3.
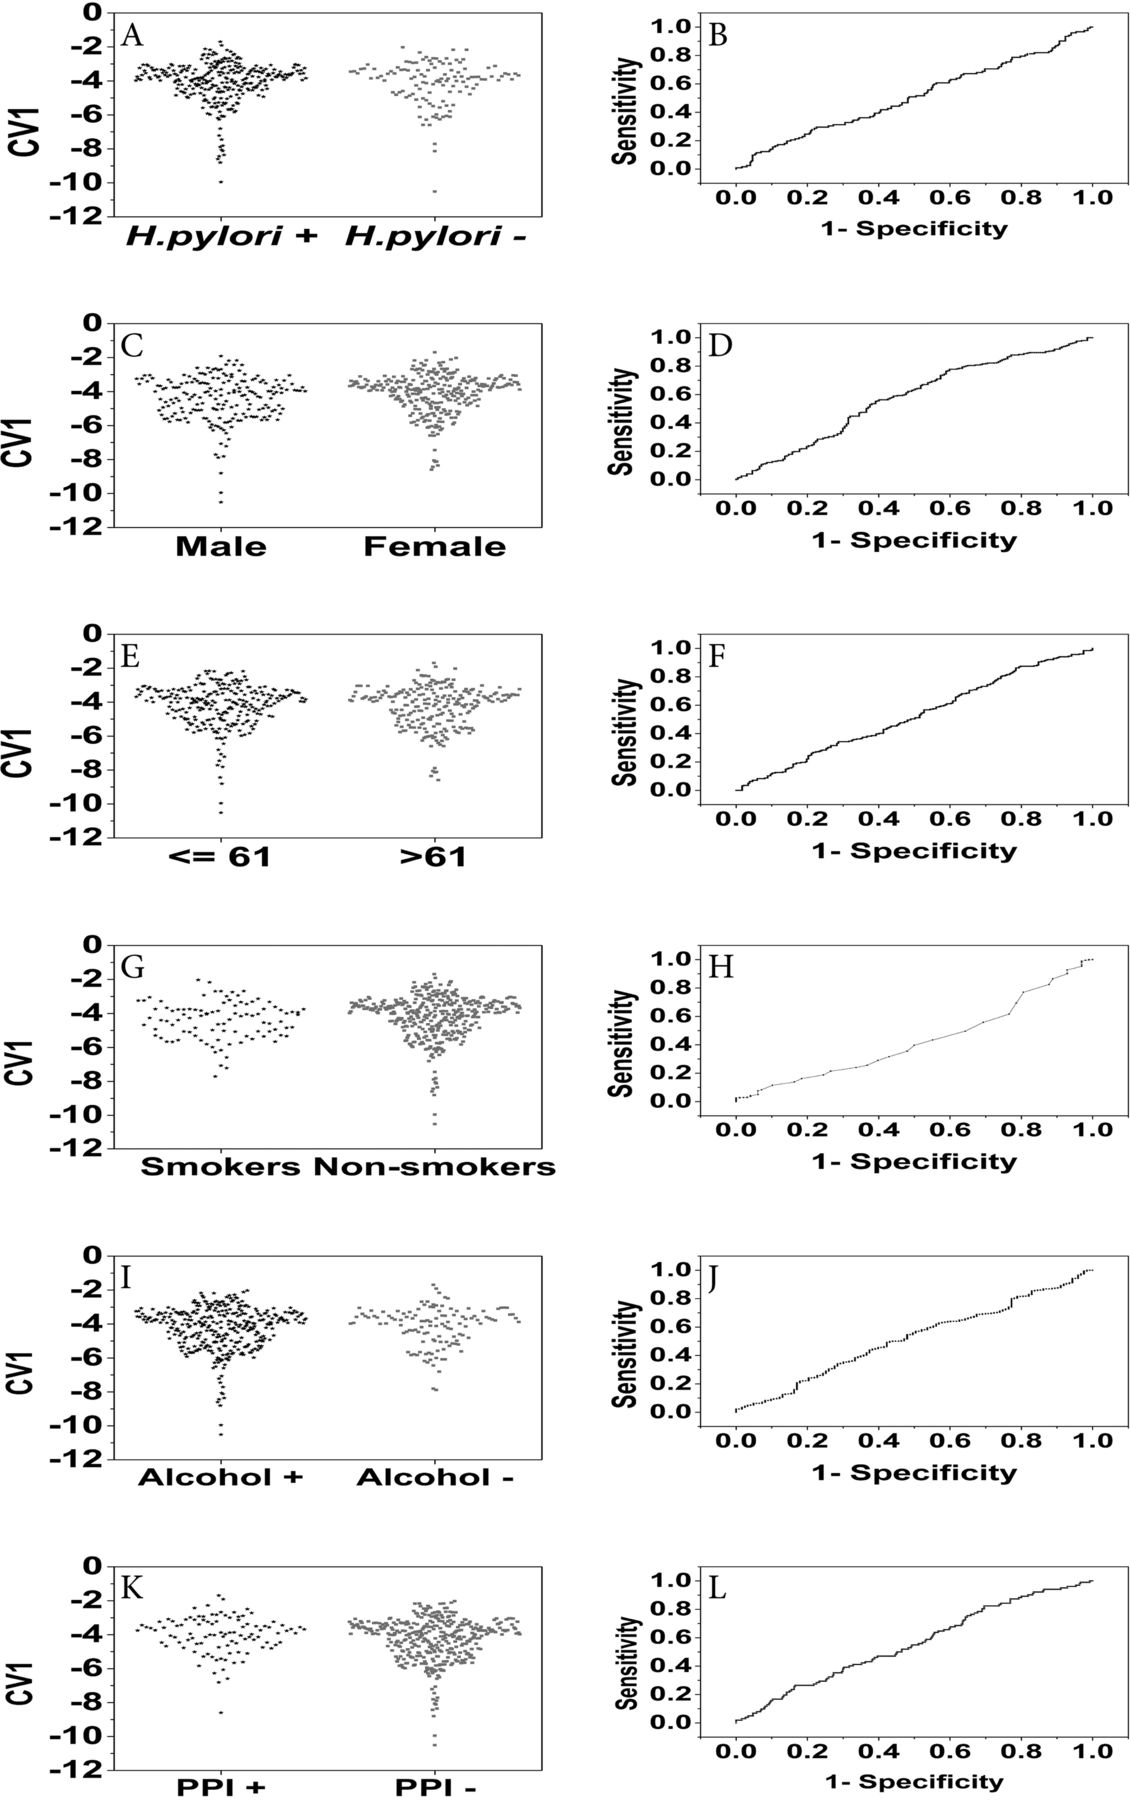
The results of the potential confounding factor (H pylori status, gender, age, smoking, alcohol use, PPI intake 1 month prior to sampling) analysis on the nanoarray results are presented in figure 4 (plotting of the results according to the DFA models is demonstrated on the images to the left, while the ROC curves on the images to the right). None of the factors demonstrated significant influence on the results; in the ROC analysis the AUC was 51% for the presence of H pylori, 57% for the gender, 52% for the age (below and above 61 years), 42% for smoking, 51% for alcohol use and 52% for PPI use 1 month prior to breath collection.

Analysis of the effect of confounding factors upon the readings of the sensors nanoarray. Discriminant factor analysis model (on the left) and the corresponding receiver operating characteristic curves (on the right). (A and B) The effect of Helicobacter pylori (H pylori) positivity; (C and D) gender; (E and F) age (>61 years or not); (G and H) current smoking; (I and J) alcohol use (>2–4 units per week); (K and L) proton pump inhibitor (PPI) intake (1 month period prior to sampling). CV1, canonical variable.
Discussion
Our GCMS analysis (see table 2) provided evidence that patients without IM in the stomach and those with precancerous lesions of various severities have breath prints different from those with GC (see also figure 2). The biochemical mechanism of VOC emission and its connection with cancer and the related precancerous lesions is still under debate.
In the following, we will briefly discuss mechanisms that could potentially explain the VOC differences between patients and controls. Oxidative stress is the main source of unbranched hydrocarbons in the body, causing lipid peroxidation of polyunsaturated fatty acids in cell membranes and generating alkanes such as ethane, pentane and other saturated C3–C11 hydrocarbons.22–24 These can stem directly from affected cells bearing precancerous lesions or from other cells elsewhere in the body and are caused by systemic oxidative stress. Cell membranes differ among cell types, so the VOCs emitted would also be distinct. In contrast, branched hydrocarbons cannot be derived from lipid peroxidation as the unsaturated fatty acids in the body are unbranched. Notably, some branched hydrocarbons were found in reduced amounts in the breath of patients with GC. CYP450 enzymes are induced during carcinogenesis, possibly resulting in hydroxylation of branched hydrocarbons into alcohols.25 The remaining hydrocarbons that are not metabolised are excreted in the breath within minutes because of their low solubility in the blood. Hence, the lung cancer-related hydroxylation of branched hydrocarbons could lead to the observed reduction in branched hydrocarbon levels and increased levels of alcohol.26–29 Alcohols, in turn, are metabolised to aldehydes by various enzymes such as alcohol dehydrogenase and CYP450, family 2, subfamily E, polypeptide 1 (CYP2E1). These enzymes occur mainly in the liver, hence the breath aldehydes are most probably of systemic origin. Several aldehydes have been found in increased concentrations in the breath of patients with precancerous lesions.27 ,30–32 Aldehydes can also be formed via CYP450 as secondary lipid peroxidation products33 or they can be systemic and local by-products of tobacco metabolism as part of the detoxification process.34
The GCMS conclusions were supported and extended by analysis with a novel and highly sensitive nanoarray (see online supplementary information, sections S2 and S3). This is important because GCMS technology cannot be applied for screening purposes since it requires expensive devices, high-level expertise and long sample analysis times and necessitates preconcentration techniques, while sensor technology easily overcomes these limitations. Furthermore, the DFA model built to test whether the eight significant VOCs can discriminate the GC group from the control group achieved only 65% success in the validation set (data not shown). The nanoarray provided excellent discrimination between patients with GC and low-risk OLGIM stages, and, critically, between patients with GC and high-risk OLGIM stages. Distinguishing low-risk lesions bearing low malignancy risk from GC and high-risk conditions by a breath test would enable unnecessary endoscopies to be avoided, thus limiting endoscopic investigations only to patients who really need them.35 We suggest that a breath test has potential for assessing patients in order to identify those progressing towards higher risk lesions or cancer. This would allow control endoscopies to be scheduled at individualised time intervals determined from the particular patient's results by avoiding fixed interval controls, which are recommended currently in patients bearing precancerous lesions.7 The above suggestion is supported by our results, in particular the high sensitivity achieved when the low-risk lesion group (OLGIM 0–II) was compared with the high-risk lesion group (OLGIM III–IV plus dysplasia) and when the group without IM (OLGIM 0) was compared with the OLGIM III–IV group (83% and 90%, respectively). This demonstrates the capacity of the nanoarray technology to identify the subgroup of patients at high risk for cancer development. Although high sensitivity is the critical indicator for identifying lesions during screening, higher test specificity would also be desirable, and additional work will be undertaken to improve the overall accuracy further.
We used the OLGIM staging system to characterise the presence and degree of precancerous lesions because interobserver agreement was better for IM than atrophy.19 Patients with OLGIM stage I–II lesions are considered to be at low risk for GC development, while those with OLGIM III–IV lesions have substantially increased risk. The lower accuracy when patients with OLGIM 0 and OLGIM I–II stages are compared could be explained by a patchy distribution of the initial metaplastic changes and by potential sampling errors in detecting these initial lesions.36 Notably, we did not analyse intestinal cancers separately from diffuse-type cancer cases; this is planned for the future, but in our current work we have concentrated on analysing precancerous lesions at various stages. Studies to confirm the predictive role of breath tests for disease progression or relapse are still required and are in progress.
Our results demonstrated that the applied nanoarray is not influenced by potential confounding factors such as age, gender, smoking habits, H pylori, alcohol use and medications such as PPIs. This is because it contains cross-reactive sensors that respond to most/all compounds in a mixture12 ,21 rather than towards a specific VOC marker. Therefore, any change in a single VOC from a given confounding factor would have negligible effect on the sensing signal compared with the signal generated by the total set of volatile compounds in the breath sample.
In summary, our results demonstrate the feasibility of the sensors nanoarray for distinguishing between malignant and non-malignant conditions as well as patients with different stages of precancerous gastric lesions from GC by a breath test. Our future vision suggests the breath test as a follow-up tool for surveillance of high-risk patients. Once a patient is diagnosed with risk lesions in the stomach by sensors nanoarray technology, and this is confirmed by conventional endoscopy, the breath test could be used for monitoring, to identify those progressing to cancer or more advanced lesions. Similarly, the test could be used for timely identification of GC recurrence following initially successful therapy. A major study on thousands of patients, some potentially bearing precancerous lesions and GC, has already started and will be conducted during the coming years in multiple centres in Europe, allowing this approach to be validated in real screening settings. The attractiveness of this test lies in its non-invasiveness, ease of use (therefore high compliance would be expected), rapid predictiveness, insensitivity to confounding factors and potentially low cost.
Acknowledgments
The authors acknowledge other expert pathologists who contributed to the pathology analysis (Dainius Janciauskas and Sergejs Isajevs) and other researchers for their contribution to this work (Dr Yoav Broza, Dr. Viki Kloper, and Mr Rotem Magal).
References
Supplementary materials
Supplementary Data
This web only file has been produced by the BMJ Publishing Group from an electronic file supplied by the author(s) and has not been edited for content.
Files in this Data Supplement:
- Data supplement 1 - Online supplement
Press Release
Files in this Data Supplement:
Footnotes
HA and ML contributed equally.
Contributors HA: Running the breath samples in the GCMS and sensors nanoarray devices, chemical and data analysis of the breath samples and writing the manuscript. ML: Involvement in the study design, coordination of patient recruitment, analysis and writing of the manuscript. KF: Coordination of patient recruitment, testing of volatile organic compounds, data management, participation in the data analysis and review and approval of the final manuscript. RS: Involvement in the study design, patient recruitment, participation in the data analysis and review and approval of the final manuscript. AS, GA and IK: Patient recruitment, participation in the data analysis and review and approval of the final manuscript. IL-K: Involvement in the study design, pathology analysis, participation in the data analysis and review and approval of the final manuscript. IL: Data collection, management and follow-up, participation in the data analysis and review and approval of the final manuscript. HH: Conception, coordination, management of the project and manuscript revision.
Funding The research leading to these results was funded from the FP7's ERC grant under DIAG-CANCER (grant agreement no. 256639; HH). The clinical work performed in Latvia was funded in part from the grant No. 305/2012 from the Latvian Council of Science.
Competing interests None.
Patient consent Obtained.
Ethics approval The study was approved by the Ethics Committee of the Riga East University Hospital Support Foundation (approval No. 4-A/11).
Provenance and peer review Not commissioned; externally peer reviewed.