Article Text

Abstract
Objectives: This paper presents a dynamic population-based model for the development of sensitisation and respiratory symptoms in bakery workers. The model simulates a population of individual workers longitudinally and tracks the development of work-related sensitisation and respiratory symptoms in each worker.
Methods: The model has three components: a multi-stage disease model describing the development of sensitisation and respiratory symptoms in each worker over time; an exposure model describing occupational exposure to flour dust and allergens; and a basic population model describing the length of a worker’s career in the bakery sector and the influx of new workers. Each worker’s disease state is modelled independently using a discrete time Markov Chain, updated yearly using each individual’s simulated exposure. A Bayesian analysis of data from a recent epidemiological study provided estimates of the yearly transition probabilities between disease states.
Results: For non-atopic/non-sensitised workers the estimated probabilities of developing moderate (upper respiratory) symptoms and progression to severe (lower respiratory) symptoms are 0.4% (95% CI 0.3 to 0.5%) and 1.1% (95% CI 0.6 to 1.9%) per mg/m3/year of flour dust, respectively, and approximately twice these for atopic workers. The model predicts that 36% (95% CI 26 to 46%) of workers with severe symptoms are sensitised to wheat and 22% (95% CI 12 to 37%) to α-amylase. The predicted mean latency period for respiratory symptoms was 10.3 years (95% CI 8.3 to 12.3).
Conclusions: While the model provides a valuable population-level representation of the mechanisms contributing to respiratory diseases in bakers, it was primarily developed for use in quantitative health impact assessment. Future research will use the model to evaluate a range of workplace interventions, including achievable reductions in exposure and health surveillance. The general methodology is applicable to other diseases such as chronic obstructive pulmonary disease, silicosis and musculoskeletal disorders and could be particularly valuable for forecasting changes in long latency diseases.
Statistics from Altmetric.com
Several studies have shown high rates of sensitisation and various (allergic) respiratory symptoms among workers exposed to flour dust.1 2 3 4 Indeed, in the UK, occupational exposure to flour dust is recognised as one of the main causes of occupational asthma.5 These respiratory symptoms can, with continuing occupational exposure, lead to work disability.6 Although reductions in occupational exposure are likely to reduce both the onset of new cases and the severity of symptoms in workers with existing conditions, supporting evidence is limited.7 8 A recent study found no evidence of a downward trend in occupational exposure to flour dust, contrary to what has been observed in other sectors.9 In an effort to decrease the prevalence of occupational respiratory diseases related to exposure to flour dust in the Netherlands, the Dutch Government, in association with labour and industry organisations, agreed to a covenant in 2001. The main goals of this covenant were the instalment of a health surveillance system focused on screening workers for work-related sensitisation and respiratory symptoms and reducing occupational exposure through encouraging good working practice and use of control measures.10 11
Health impact assessment provides a means to maximise the improvement in health through (prospectively) evaluating a range of possible intervention scenarios.12 13 Although health impact assessment methodologies, including dynamic life table approaches, have been used to assess the impact of changes in the living environment on public health,14 15 the use of these techniques within the occupational health arena has been more limited.13 One recent occupational example is a study by Wild et al16 who evaluated impact of a surveillance programme for occupational asthma among workers exposed to (di-)isocyanates. However, this study, as is also the case in many public health studies, does not explicitly take into account empirical information on exposure distributions and dose/exposure–response relationships.
What this paper adds
Occupational exposure to flour dust and associated allergens are well-documented causes of sensitisation and respiratory symptoms in bakery workers.
While population-based approaches have previously been used to model occupational diseases, and occupational asthma in particular, this is the first study that we are aware of that explicitly incorporates quantitative exposure–response relationships and population exposure distributions into a model of a temporally changing population.
The model is a valuable tool for health impact assessment allowing a range of interventions to be evaluated, some of which (eg, health surveillance) are difficult to prospectively evaluate using other means.
The general methodology is applicable to other diseases such as chronic obstructive pulmonary disease, silicosis and musculoskeletal disorders, and is particularly valuable for forecasting gradual changes in long latency diseases.
The dynamic population-based health model described in this paper enables prospective health impact assessment to be carried out for respiratory diseases in bakery workers occupationally exposed to flour dust. The model simulates a population of workers longitudinally through time and tracks the development of sensitisation and respiratory symptoms in each worker in response to their occupational exposure to flour dust. This approach allows the progression of the disease and transitions between different disease states over time to be studied, particularly in response to changes in the population’s exposure distribution. Furthermore it enables more realistic modelling of the future disease burden related to alternative exposure population distributions. The proposed approach using a dynamic population-based model should therefore provide an important tool for health impact assessment enabling evaluation of the potential effects of interventions and the distribution of these effects within a population.
The model
General structure of the model
Our dynamic population-based model simulates a population of workers longitudinally through time and tracks the development of sensitisation and symptoms in each worker. The working population is dynamic with a continual process of workers leaving the workforce (possibly through ill-health) and being replaced with new recruits. There are three main components of the model:
A multi-stage disease model describing the development of work-related sensitisation to wheat and fungal α-amylase, severity of symptoms and disability.
An exposure model characterising variation in dust and fungal α-amylase exposures between workers and over time.
A population model that describes migration of workers and population characteristics.
The main states in our model are work-related sensitisation to wheat and fungal α-amylase, moderate (upper respiratory) and severe (lower respiratory) symptoms and work-related disability. Different combinations of these give rise to 13 different diseases states as depicted in fig 1 and listed in table 1. The underlying structure of the model and assumptions have been based on recent mechanistic insights.17 Work-related sensitisation to wheat flour and fungal α-amylase is assumed to be a key determinant, and pre-existing atopy (specific IgE response to common allergens) is assumed to modify the risk for development of respiratory symptoms and disease.1 2 5 18 19 Both are explicitly incorporated in the model. Furthermore, the model assumes that upper airway symptoms generally precede the development of lower respiratory symptoms, although not exclusively.16 20 21 22 Eventually workers having severe lower respiratory symptoms may develop work-related disability and leave the workforce.6 23 24 Figure 1 depicts many of the transitions as being reversible; however, due to inconsistent information on the relationship between exposure reduction (or cessation) on recovery and remission of symptoms,7 17 25 all recovery probabilities are currently set to zero. This could be relaxed in the future, if more detailed longitudinal observations become available.
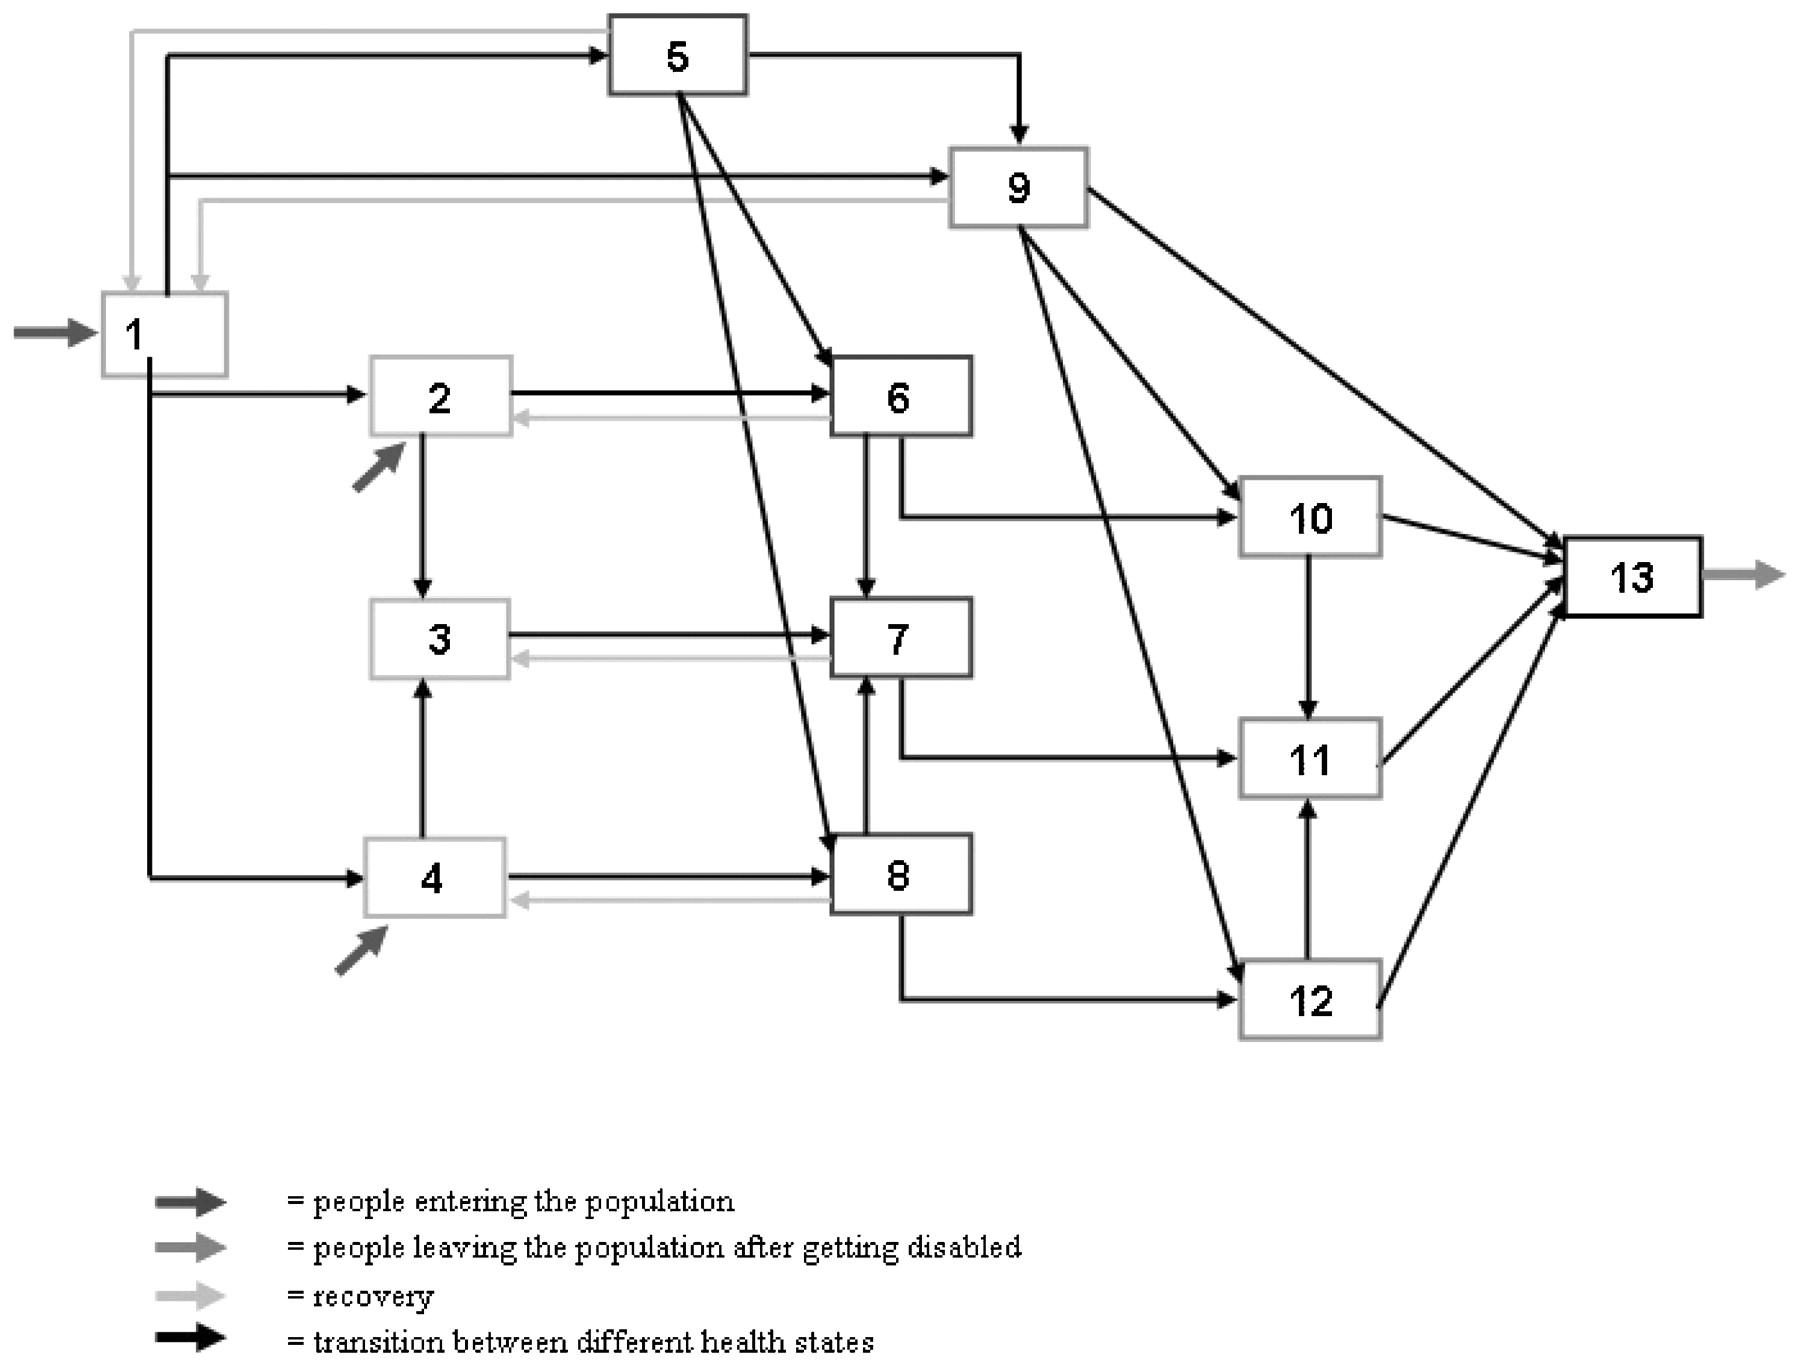
Causal diagram of population dynamic health model showing all possible health transitions within the population relating to the development of sensitisation and respiratory symptoms.
Summary of different health states within the model
Disease progression (ie, development of sensitisation and symptoms) in an individual is modelled through a discrete time Markov Chain that updates the disease state of each individual yearly on the basis of their exposure. In the current model only “single change” yearly transitions are allowed, that is, development of sensitisation to wheat or fungal α-amylase or development of symptoms. However, if it is assumed that work-related sensitisation to α-amylase and wheat and the development of symptoms (conditional upon current sensitisation) are independent processes then more complex transitions might also be possible, though much less likely. These rare two-change transitions, for example, development of sensitisation to both wheat and α-amylase in the same year are not currently modelled (see the online appendix for the matrix of transition probabilities).
Estimation of dose/exposure–response parameters
Transition probabilities are calculated using a number of dose–response models estimated from a study on symptoms and serological responses from 860 randomly selected workers. These data were collected in the context of the Health Surveillance System in the baking industry in The Netherlands, described elsewhere.4 The probabilities assume a linear yearly dose response dependent upon the current year’s exposure with no threshold. The assumption of a linear yearly dose response which, for low probabilities, approximates a lifetime risk proportional to cumulative exposure, is compatible with recent studies4 26 which present a reasonable linear shape for the first part of the dose–response curve, flattening off at higher exposures (most likely caused by a healthy worker effect or development of tolerance).
First, dose–response relationships for the development of work-related upper and lower airway symptoms in non-sensitised individuals were estimated using flour dust as the causal agent. Following this, additional risk factors for developing work-related respiratory symptoms when sensitised to wheat or fungal α-amylase were estimated using logistic regression (with atopy and cumulative exposure to flour dust as additional covariates). These were integrated as multiplicative factors into the original dose–response models for non-sensitised individuals to obtain separate dose–response relationships for all sensitised groups. Finally, dose–response relationships for the development of sensitisation to wheat and fungal α-amylase were estimated using flour dust and exposure to fungal α-amylase as the respective causal agents. In all cases, separate dose–response relationships were determined for atopics and non-atopics. A detailed description of the Bayesian methodology used to estimate yearly dose–response probabilities for sensitisation and symptoms may be found in the online appendix.
Description of disease states
The different disease states and the estimated transition probabilities are discussed below with probabilities presented per unit exposure (mg/m3 for flour dust and ng/m3 for fungal α-amylase). The entire set of model parameters with accompanying confidence intervals are presented in table 2.
Model parameters and literature sources
State 1: healthy workers
This state represents non-sensitised individuals without respiratory symptoms and is the entry state to the population for the majority of new workers.
States 2, 3, 4: sensitisation to wheat, fungal α-amylase or both
The early states in our model are work-related sensitisation to wheat allergens, and/or fungal α-amylase without symptoms. The yearly probability for becoming sensitised to wheat allergens or fungal α-amylase is approximately 0.1% per unit exposure for non-atopic workers but considerably higher for atopic workers at approximately four times higher for fungal α-amylase and eight times higher for wheat allergens (table 2).
States 5, 6, 7, 8: “moderate” (upper respiratory) symptoms
Moderate symptoms are defined as reporting at least two of the following three symptoms: sneezing, a runny nose, or itchy/teary eyes during work, but without lower respiratory symptoms (as defined below). Workers can develop upper respiratory symptoms through two routes: either the worker develops work-related sensitisation first and then develops allergic upper respiratory symptoms, or the worker develops upper respiratory symptoms without sensitisation (irritation route). The latter causal route is not completely understood but both upper and lower respiratory symptoms, as well as hyper-responsiveness, have been observed in bakery workers in the absence of sensitisation.17 27 The probability of developing upper respiratory symptoms was estimated as approximately 0.4% per unit exposure per year for non-atopic/non-sensitised workers and approximately twice this for atopic workers (table 2). Multiplicative risk factors for workers sensitised to wheat and fungal α-amylase were estimated as 3.2 and 2.2, respectively (table 2).
States 9, 10, 11, 12: “severe” (lower respiratory) symptoms
Severe symptoms are defined as reporting at least two of the following lower respiratory symptoms: asthma attacks, wheezing, shortness of breath or tightness of chest during work. Workers can develop symptoms either with or without first being sensitised. The probability of progressing to severe symptoms from moderate symptoms is 1.1% per unit exposure per year for non-atopic, non-sensitised workers and 1.7% for atopic non-sensitised workers (table 2). These transition probabilities increase for sensitised individuals using the same multiplicative risk factors as those adopted for moderate (upper respiratory) symptoms.
State 13: drop-out due to lower respiratory symptoms
The final disease state of our model is work disability, defined as having work-disabling asthmatic symptoms. In the current model only workers that develop severe respiratory symptoms can explicitly leave the workforce because of their symptoms, that is, through work disability. Although a large amount of literature is available describing hospitalisation and work disability among workers with severe respiratory symptoms,6 8 17 the yearly probability of becoming disabled cannot easily be ascertained. To our knowledge there are only limited longitudinal data relating to the likelihood of becoming work disabled once respiratory symptoms have developed and any data that are available relate to diagnosed cases of asthma rather than our broader definition based upon self-reported symptoms. We have set the disability rate in the current model to a fixed rate of 5% per year irrespective of exposure. This is substantially lower than the value of 60% disabled after 4 years used by Wild et al16; however, (di-)isocyanate asthma has a worse prognosis for developing work disability than flour dust.
Exposure
Separate exposures to flour dust and fungal α-amylase are modelled through a bivariate log-normal random effects model. That is:
Ln(Ei,j) = μ + δi + εi,j (1)
where Ei,j is the dust and fungal α-amylase exposure of a random worker (i) on a random day (j) and the mean (log) exposure of the population is represented by μ. The random worker effect δi and the residual variation εi,j have independent bivariate normal distributions with diagonal covariance matrices σB (between-worker variability) and σW (within-worker variability), respectively, implying independence of dust and α-amylase, consistent with the extremely low correlations reported elsewhere.10
Upon entering the working population, each worker is assigned two standardised between-worker random effects that are scaled according to the between-worker variance components for dust and α-amylase. Subsequently, each individual’s yearly mean exposures are calculated taking into account within-worker variability in the following manner:
mean exposure = exp(μ + δi + 0.5σw2
Temporal changes in the population exposure distribution may be modelled by altering μ over time, while by assigning each worker a standardised random effect, temporal changes in between-worker variability may be modelled (perhaps as a consequence of an intervention) while preserving each worker’s relative position in the population exposure distribution. The baseline exposure parameters used in our model were derived from Jacobs et al4 and Meijster et al10 (table 2).
Population characteristics
The population model determines all population characteristics and dynamics not related to exposure and/or symptoms. New individuals enter the population healthy but with a fixed probability of being atopic (30%) and a small likelihood of already being sensitised to either wheat or fungal α-amylase (2% and 1%, respectively18 19 28; table 2). Each new worker is assigned a natural (ie, unimpeded by asthma) working lifetime generated from a negative binomial distribution (mean 20 years, coefficient of variation = 0.6, truncated at 1 and 50 years) chosen for consistency with cross-sectional data on length of working careers.4 The proportion of atopic individuals in the population (30%) was based upon serological testing of workers in the Health Surveillance System database.4 Subjects were classified atopic if they had at least one positive response to house dust mite allergens, cat or dog allergens, grass or birch pollen. An individual leaves the simulated working population when they either come to the end of their natural working life, or become disabled. In both cases, they are replaced with a new individual with a fixed probability (1 in the current model to maintain a constant population size).
Simulation of the model
The model is implemented in MATLAB29 allowing efficient simulation using parallel calculations. An appropriate starting population, complete with exposure histories, sensitisation, and symptoms is created through running the model for a “burn-in” period with an initial non-symptomatic population of workers who all start work simultaneously. By choosing a sufficiently long burn-in period, for example, 100 years, the population achieves steady state by the first year of interest. Thereafter, temporal fluctuations in the number of individuals in each disease state reflect the genuine stochasticity of the population.
Each run of the model gives data on all the individuals ever present in the population including their yearly sequence of disease states, their yearly exposure history, and their atopic status. These data may then be interrogated to extract cross-sections of data for any given year and calculate the prevalence and incidence of disease states. Other population characteristics such as the cross-sectional distribution of current years worked or the proportion of atopic individuals in different states may also be determined. Baseline values were calculated as the average prevalence and incidence for each disease state over 100 simulations of a 50-year period for a population size of 10 000 (the approximate size of the population at risk in Dutch bakeries). This yields the expected prevalence and ignores stochastic year-to-year fluctuations. Confidence intervals for incidences and prevalences were obtained by running 1000 model runs in the same way as for the baseline simulation but with (independent) random parameter values sampled from distributions corresponding to the confidence intervals presented in table 2.
A sensitivity analysis to provide insight into the dependencies between the model’s behaviour and the input parameters was conducted using a local sensitivity ratio method. A detailed description of the sensitivity analysis and results can be found in the online appendix.
Baseline model results
Table 3 presents the predicted prevalence and incidence (new cases per 1000 workers per year) with their respective 95% confidence intervals for the major groupings of disease states for the simulated baseline situation (results for all 13 disease states are presented in supplementary table 3a in the online appendix). Our model predicts approximately 75% of workers will be neither sensitised nor symptomatic, around 12% will have moderate respiratory symptoms and a further 8% will have severe respiratory symptoms. The predicted prevalences of sensitisation to wheat and α-amylase are similar, both being around 10%. For work disability the set-up of the model (where disabled individuals leave immediately) is such that only incidence can logically be estimated at approximately four cases per thousand.
Predicted annual prevalence, incidence (expressed as cases per 1000 workers) and proportion atopic for major groupings of disease states with accompanying 95% confidence intervals
The proportion of workers who are atopic ranges from 40% in those with moderate symptoms to just over 60% in those sensitised to wheat but is only 20% in non-sensitised, non-symptomatic workers (the latter value not shown in table 3). The proportion of symptomatic workers sensitised to wheat and α-amylase has also been determined: for those with moderate symptoms, 15% (95% CI 11 to 20%) are sensitised to wheat and 13% (8 to 20%) to α-amylase rising to 36% (26 to 46%) and 22% (12 to 37%), respectively, in workers with severe symptoms.
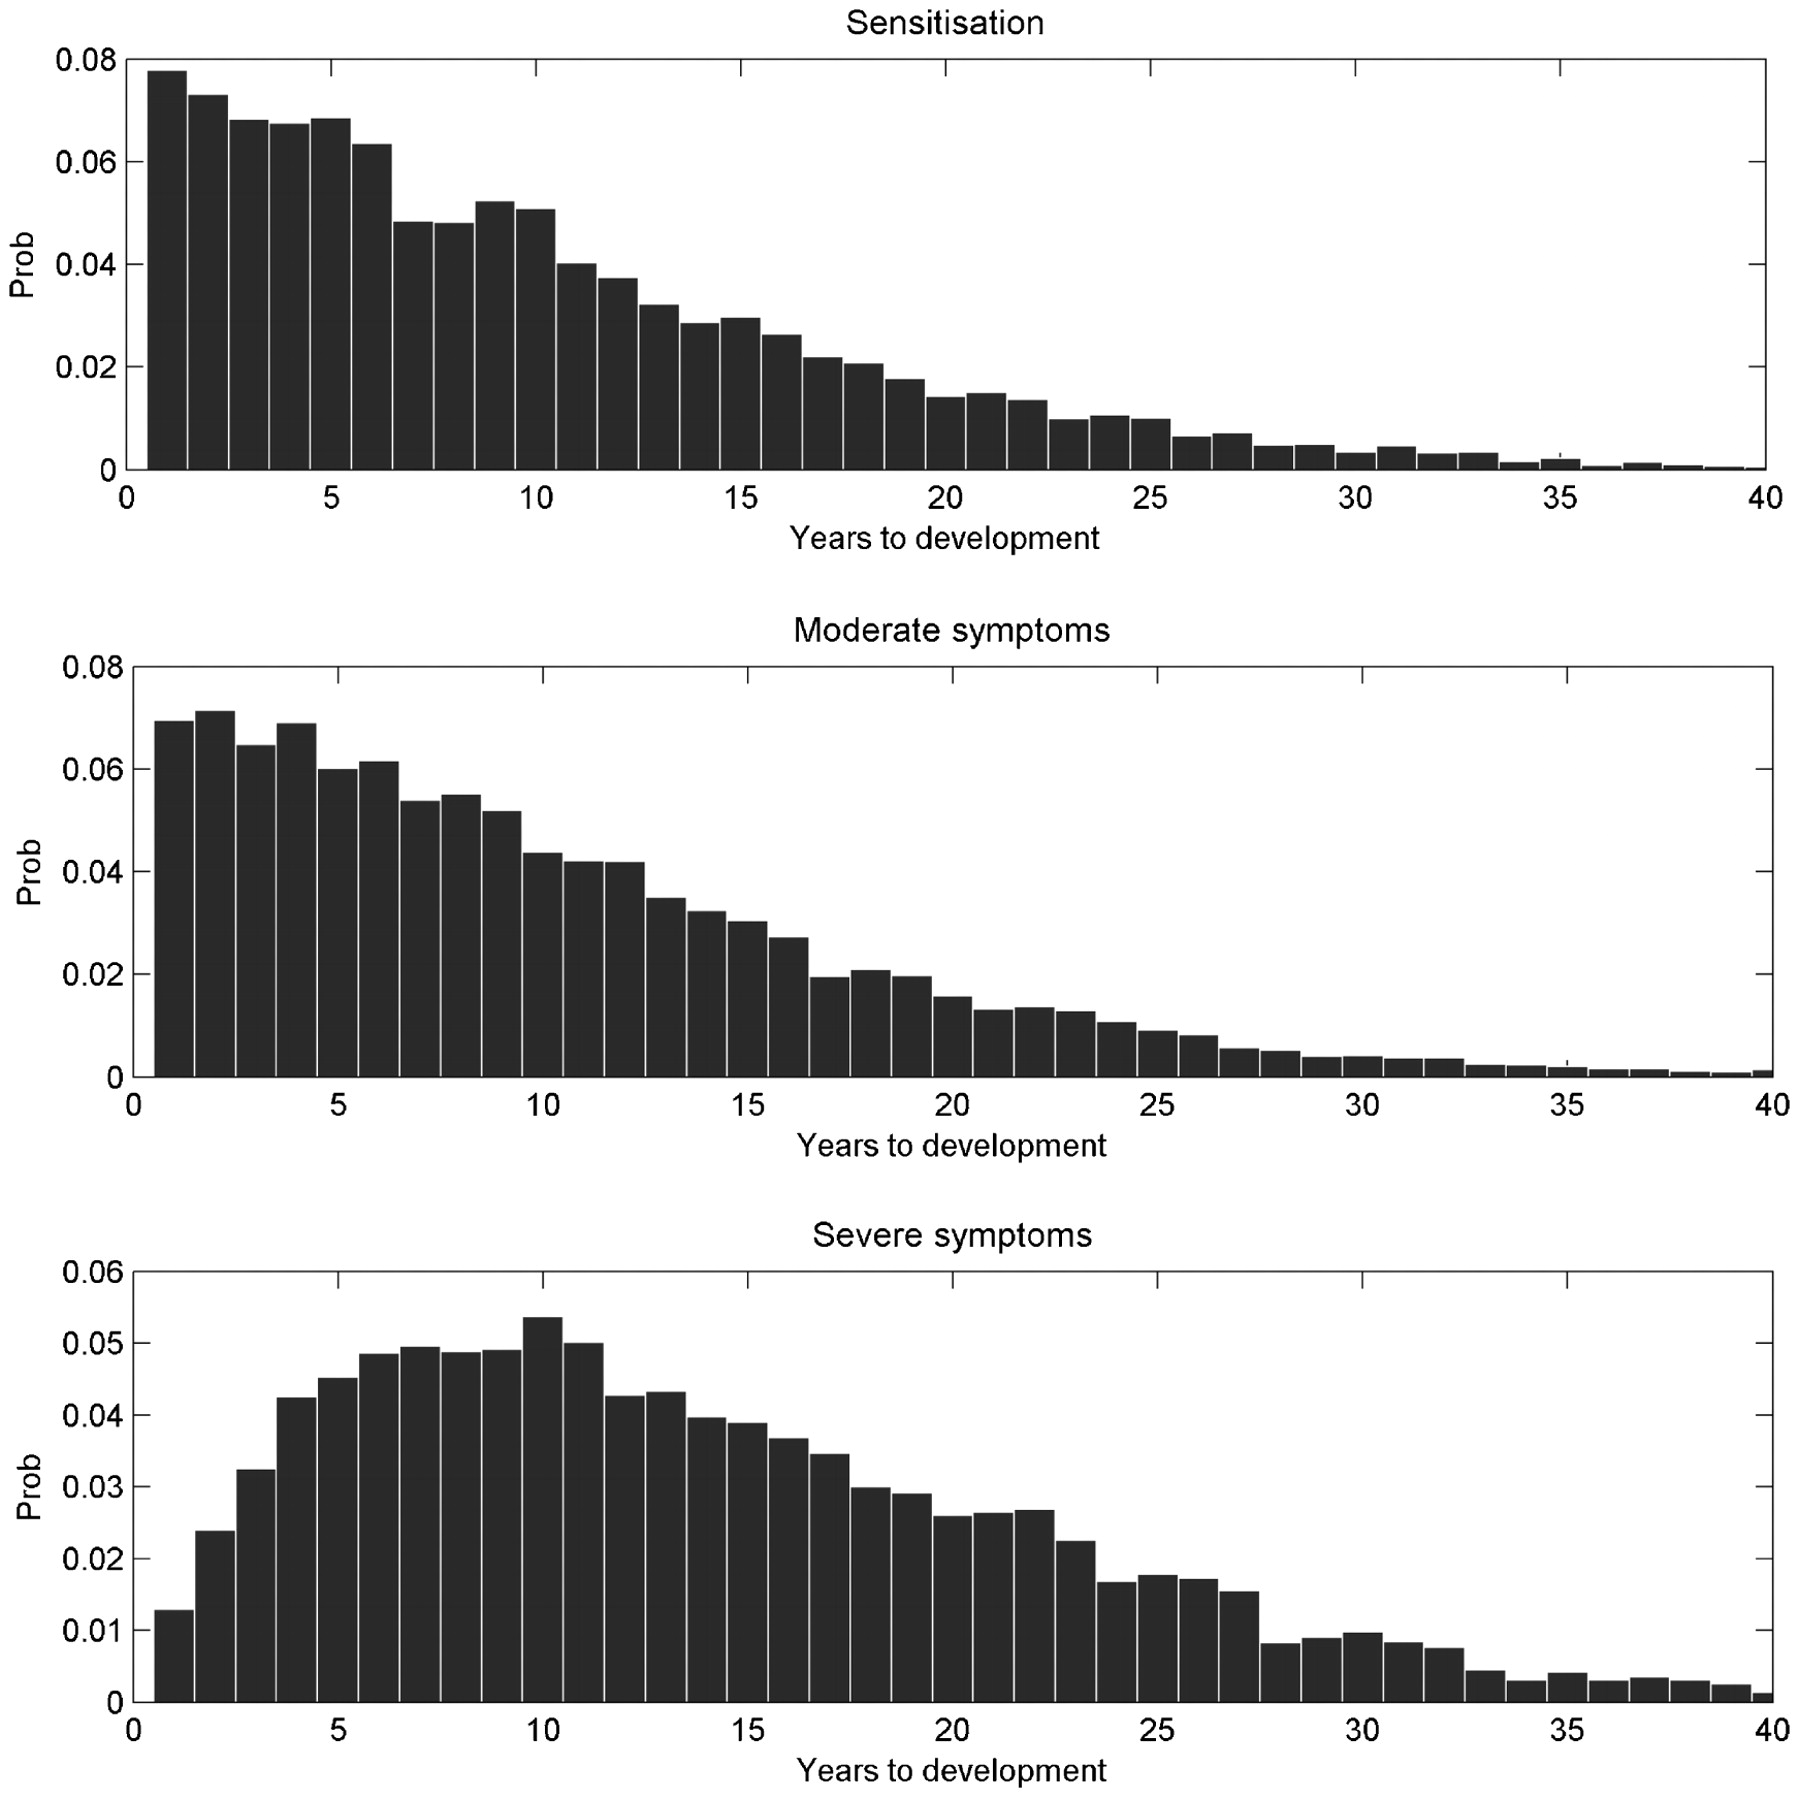
Figure 2 shows the distribution of the number of years to first onset of work-related sensitisation and work-related respiratory symptoms. Both sensitisation and moderate symptoms develop primarily within the first 10 years of employment with the majority in early years and considerably fewer cases thereafter. For severe symptoms, the peak of onset occurs later at around 10 years of employment and remains high for a considerable period afterwards. Taking respiratory symptoms as a whole, our model predicts a mean latency period of 10.3 years (95% CI 8.3 to 12.3).
The distribution of the number of work years to first onset of sensitisation and symptoms.
Discussion and conclusions
To our knowledge, this paper presents one of the first attempts to develop a quantitative dynamic disease model in an occupational setting. It shows how epidemiological, exposure and population data obtained from different data sources can be integrated to develop a dynamic population-based model that can be used for quantitative health impact assessment. In the future, this approach may provide an important contribution to the selection of cost-effective preventive policies at the workplace. However, it is clear that the value of model to health impact assessment is contingent upon it providing an adequate representation of the underlying processes and mechanisms
For respiratory symptoms our predictions are generally slightly lower than the prevalences reported in cross-sectional studies in the Netherlands,1 UK30 31 and other countries.32 33 However, one German study18 reported significantly higher prevalences for both sensitisation and respiratory symptoms than both our model and most other studies. According to the authors this was most likely caused by selection bias (unhealthy workers might have been more likely to participate), differences in symptom definitions and the analytical methodologies used. These are general issues surrounding comparisons of both longitudinal and cross-sectional studies looking at allergy and respiratory symptoms and makes clear-cut conclusions on observed differences difficult. In general, most input data for this study come from cross-sectional studies and there is a need for more longitudinal observations to allow better estimation of the magnitude of the healthy worker effect and the transition from moderate-to-severe disease states.
Greater disparities are found between the incidence figures and published literature. For sensitisation the most likely cause is differences between the study populations. Since sensitisation is known to occur primarily in the first few years of exposure, this leads to higher incidences being reported in studies of new workers, for example, apprentices (which is the case in most longitudinal studies2 19 22 34 35) whereas our dynamic model simulates the total population of workers. For symptoms, while this might also play a role, it is likely to be less prominent due to the longer latency period. Instead, the definition of symptoms is likely to be a more important cause of differences. A more fundamental reason for differences in both incidence and prevalence figures could be differences in exposure levels between studies. Unfortunately, of the longitudinal studies, only Cullinan et al2 present quantitative exposure levels, which are approximately comparable to those used in our model.
We also compared time to development of symptoms with a longitudinal study of 90 bakery workers in the UK36 which reported an average latency period of 7.3 years with 47% of symptoms within the first 4 years and 22% taking ⩾10 years to develop. Our model shows considerable concordance predicting an average latency period of 10.3 years to first symptoms with 38% of cases taking ⩾10 years to develop. The observed difference might result from a different exposure distribution (higher exposures might decrease the latency period) or a difference in population susceptibility (eg, prevalence of atopy).
The model predictions for the proportion atopic and proportion sensitised by severity of symptoms also exhibit close agreement with cross-sectional studies in the Netherlands. For example, in the study by Jacobs et al (2008) the proportion atopic using our definitions of moderate and severe symptoms was 46% and 54%, respectively, compared with 40% and 52% in our model. Similar close agreement was obtained for the proportion sensitised. It must be recognised that these are favourable comparisons as this study was used in the estimation of the dose–response parameters for our model. Nevertheless, our model has not been fitted to this study in the conventional sense of optimising the input parameters to provide the closest alignment between the model predictions and the observational data.
While considerable effort has been taken to ensure that all the model parameters are evidence based, the estimation of some parameters could be improved. For example, the estimation of the dose–response parameters ignores the influence of workers becoming disabled and leaving employment in the bakery sector. This “healthy worker effect” leads to negative bias in the estimates of the slopes of the dose–response relationships. A possible future application of our model would be to estimate the magnitude of this bias through estimating the dose–response parameters from simulated cross-sectional groups of workers and comparing the derived slope parameters to the input slopes. The multiplicative risk factors for the increased risk of symptoms given sensitisation to wheat and fungal α-amylase have been calculated from the cross-sectional health surveillance data using logistic regression. However, because workers only experience an increased risk of developing symptoms for the (unknown) fraction of their career for which they are sensitised, our logistic regression-derived estimates of the multiplicative risks will under-estimate the true yearly multiplicative risks. This implies our model should underestimate the total number of symptomatic individuals, although comparison with observational studies suggests this underestimation is relatively modest.
Another important assumption in our model is that reversal of symptoms and sensitisation is not considered possible while still working in the bakery industry (all recovery probabilities in the model are currently set to zero). For respiratory symptoms, especially lower respiratory symptoms, this assumption is supported by several publications suggesting that once a worker develops occupational asthma the chances of recovering when still exposed are minimal.17 37 This is less obvious for early states of disease processes such as sensitisation and upper airway symptoms. However, a recent study25 shows strong remission for both work-related sensitisation and rhinoconjunctivitis symptoms in a cohort of workers exposed to high molecular weight allergens. Although information on the associated exposure in this study was limited, and the information was not specifically on bakery workers, the results indicate that further refinement of this aspect of the model might be necessary, if more detailed data were to become available.
The dose response for sensitisation to wheat is based upon exposure to flour dust (which we also used for estimating the dose responses for symptoms) rather than wheat exposure. However, as flour dust and wheat allergen exposure are highly correlated10 comparable dose–response relationships for wheat sensitisation are obtained with either exposure metric. An obvious refinement of the exposure model would use separate strata for particular jobs within the traditional and industrial bakery sectors thereby allowing the modelling of individuals transferring between jobs or sectors. The authors hope to implement these changes in the future to allow more realistic modelling of health surveillance schemes.
Our model does not distinguish between lower respiratory symptoms with and without upper respiratory symptoms, both being classed as “severe”. This decision was taken partly through an appreciation that many health surveillance schemes would regard both as equal priorities for intervention and partly due to the small number of workers with lower respiratory symptoms but without upper respiratory symptoms (<3% in the study of Jacobs et al4). Furthermore, the model has been limited to sensitisation and respiratory symptoms since they are generally believed to be the most severe and disabling health effects in workers exposed to flour dust.38 In the current model, work disability is only associated explicitly with lower respiratory symptoms. Although asthma is generally acknowledged as the most severe and disabling state, it is known that upper airway symptoms might also lead to workers leaving. In the future this could be incorporated as a separate route in the model – if data would become available. The model could be easily extended to other disease outcomes (eg, allergic dermal symptoms) or to include other exposure routes (eg, rye exposure) if these were considered to play an important role, the mechanisms were sufficiently understood, and suitable data were available. This makes the model flexible and easy to adapt to other, slightly different situations.
The results presented here only represent a part of the possible outputs from the model. The model may also be used to investigate the importance of different progression routes to a particular disease state, for example, the proportion of sensitised workers with lower respiratory symptoms that were sensitised first – something that is often assumed but cannot be verified in cross-sectional studies. The model might also be used to calculate lifetime risks or the probability of, for example, a sensitised individual developing severe symptoms within a certain period. However, although our model provides a valuable population-level representation of the mechanisms contributing to respiratory diseases in bakers, it was primarily developed for use in health impact assessment. A future paper will describe the application of the model to the evaluation of a range of workplace interventions, including achievable levels of exposure reduction and health surveillance schemes.
The results of this paper show the need for further longitudinal data to help develop and validate models, such as the one presented here, which can be used for prospective health impact assessment. Therefore, epidemiological research agendas should be more focused on longitudinal studies that can disclose information on disease progression mechanisms that cannot readily be obtained from cross-sectional studies.
REFERENCES
Footnotes
Competing interests None declared.
Provenance and peer review Not commissioned; externally peer reviewed.