Article Text

Abstract
Introduction Increased age has been reported to be a factor for COVID-19 severe outcomes. However, many studies do not consider the age dependency of comorbidities, which influence the course of disease. Protection strategies often target individuals after a certain age, which may not necessarily be evidence based. The aim of this review was to quantify the isolated effect of age on hospitalisation, admission to intensive care unit (ICU), mechanical ventilation and death.
Methods This review was based on an umbrella review, in which Pubmed, Embase and preprint databases were searched on 10 December 2020, for relevant reviews on COVID-19 disease severity. Two independent reviewers evaluated the primary studies using predefined inclusion and exclusion criteria. The results were extracted, and each study was assessed for risk of bias. The isolated effect of age was estimated by meta-analysis, and the quality of evidence was assessed using Grades of Recommendations, Assessment, Development, and Evaluation framework.
Results Seventy studies met our inclusion criteria (case mortality: n=14, in-hospital mortality: n=44, hospitalisation: n=16, admission to ICU: n=12, mechanical ventilation: n=7). The risk of in-hospital and case mortality increased per age year by 5.7% and 7.4%, respectively (effect size (ES) in-hospital mortality=1.057, 95% CI 1.038 to 1.054; ES case mortality=1.074, 95% CI 1.061 to 1.087), while the risk of hospitalisation increased by 3.4% per age year (ES=1.034, 95% CI 1.021 to 1.048). No increased risk was observed for ICU admission and intubation by age year. There was no evidence of a specific age threshold at which the risk accelerates considerably. The confidence of evidence was high for mortality and hospitalisation.
Conclusions Our results show a best-possible quantification of the increase in COVID-19 disease severity due to age. Rather than implementing age thresholds, prevention programmes should consider the continuous increase in risk. There is a need for continuous, high-quality research and ‘living’ reviews to evaluate the evidence throughout the pandemic, as results may change due to varying circumstances.
- COVID-19
- epidemiology
- systematic review
Data availability statement
All data relevant to the study are included in the article or uploaded as supplementary information. The data used was extracted from primary studies and are available in the full text or supplementary material.
This is an open access article distributed in accordance with the Creative Commons Attribution Non Commercial (CC BY-NC 4.0) license, which permits others to distribute, remix, adapt, build upon this work non-commercially, and license their derivative works on different terms, provided the original work is properly cited, appropriate credit is given, any changes made indicated, and the use is non-commercial. See: http://creativecommons.org/licenses/by-nc/4.0/.
Statistics from Altmetric.com
Key questions
What is already known?
Increasing age and comorbidities are risk factors for COVID-19 severe outcomes, such as hospitalisation and mortality. However, comorbidities such as diabetes, cardiovascular disease, chronic pulmonary diseases increase with age and the isolated effect of age on COVID-19 disease severity is not known.
What are the new findings?
The risk of COVID-19 disease severity due to the isolated effect of age increases by age year, and no specific age threshold was observed.
A best possible quantification of the increase in risk of COVID-19 severe outcomes due to age has been done.
What do the new findings imply?
Any workplace restrictions targeting a particular older age group are rather arbitrary and may contribute to ageism in the society.
If scores are to be built to assess an individual’s risk for COVID-19 severe outcomes in workplace settings, these should be based on per-age increases.
Introduction
Since identified in Wuhan, China, in December 2019,1 COVID-19 has caused more than 3.4 million deaths worldwide.2 Early on, the increase COVID-19 adverse outcomes in the older population was observed.3–6 Chronic diseases, which increase with age, are also established risk factors for COVID-19 disease severity.7 8 However, age and age-related risk factors, are often not decoupled in studies.9 Since mortality rates are often presented by age groups,10 prevention strategies targeting older age groups in the workplace were started. After the first wave, the Federal State of Lower Saxony in Germany encouraged teachers over the age of 60 years to work from home. Recently, an IKKA (Immunosupression, Known severity of any pre-existing condition, Known risk actors as defined by the Robert Koch Institute, and Age) score was developed in Germany for workers in order to establish, among other things, age-based criteria that could decide on the admissibility of work attendance.11 The risk score was partly-based on the age group of the individual (<50 years: score=0; 50–59 years: score=4; ≥60 years: score=10). There have been discussions concluding in a consensus over the need to improve the risk score based on current evidence regarding the isolated effect of age on COVID-19 disease severity.12 In general, we should be careful to classify 60 years of age as risk persons (or any other age group starting at a particular ‘arbitrary’ age), as this can considerably reduce the chances of older unemployed people finding a job or make them ‘targets’ for layoffs.
In mid-2020, we published a rapid review investigating the isolated effect of age on COVID-19 disease severity, that is, the direct effect of age after accounting for important age-related risk factors such as diabetes, cardiovascular disease and chronic pulmonary disease. The result was that the effect of age was rather small.13 This review was based mainly on Chinese studies published early in the pandemic. As more studies have been published worldwide, a different picture might emerge, and it is necessary to examine the newly acquired evidence on the isolated effect of age on COVID-19 disease severity. Furthermore, it is crucial to follow-up this previous work with a more comprehensive systematic review, where studies are evaluated independently by two scientists, both in their inclusion and their quality. Ideally, a systematic review will also include a systematic assessment of the overall quality of evidence based on Grades of Recommendations, Assessment, Development, and Evaluation framework (GRADE), which was lacking in the rapid review.
We aim to gather information on published studies to answer the following:
What is the isolated effect of age on COVID-19 disease severity (hospitalisation, admission to the intensive care unit (ICU), mechanical ventilation or death due to COVID-19), after adjusting for important age-related risk factors?
Is there evidence of an age threshold in which the risk of COVID-19 increases rapidly?
Methods
Search, selection and data extraction
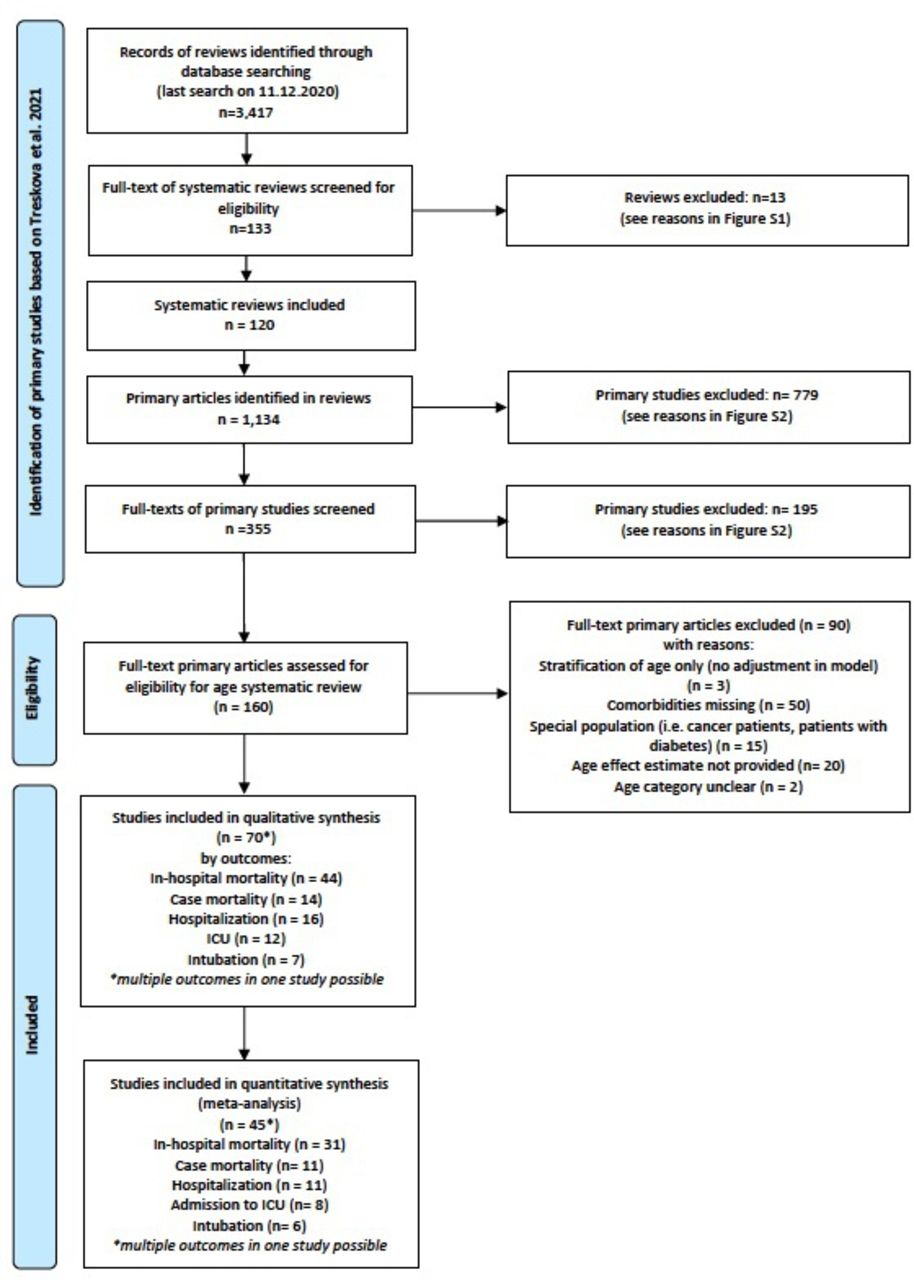
This systematic review was based on an umbrella review on pre-existing health conditions and severe COVID-19 outcomes published elsewhere.14 To summarise, on 11 December 2020, a systematic search for systematic reviews was done in PubMed and Embase, with hand searches on preprint servers (search string in supplement). The included systematic reviews investigated the association between at least one chronic health condition and a severe COVID-19 outcome, such as hospitalisation, ICU admission, intubation or death. After screening the titles and abstracts, followed by full-text screening, 120 systematic reviews were included (online supplemental figure S1). Then, primary studies included in these reviews were screened. They were included in the analysis if they reported at least one quantitative measure of association in persons with pre-existing health conditions and at least one age-adjusted estimate. One hundred and sixty primary studies were included in the umbrella review (online supplemental figure S2).
Supplemental material
Selection process for primary studies from original umbrella review (Treskova et al 2021).14
To find adequate primary studies for the purpose of our research question regarding age and COVID-19 disease severity, we excluded studies investigating special populations, such as patients with cancer or persons with diabetes. Studies were included if the age effect had been adjusted for at least three of the following comorbidities: diabetes mellitus, cardiovascular disease, cancer/immunodeficiency, chronic kidney disease, chronic liver disease and chronic pulmonary disease (see table 1 for eligibility criteria). Two independent scientists screened the full texts of the studies. In case of disagreement, a consensus decision was sought between both scientists. If no agreement was achieved, the decision was made by a third reviewer.
Eligibility criteria
Data extraction was done by one reviewer and checked by another one. In case of missing information, study authors were contacted. The data extraction form included information on the first author, publication year, country of origin, study population, age and sex characteristics, outcome assessment, confounders, analysis methods and results. A protocol of the review was registered a priori with the PROSPERO database of systematic reviews (https://www.crd.york.ac.uk/prospero/display_record.php?RecordID=220614).
Risk of bias assessment
We evaluated the overall risk of bias for each study as ‘low’ or ‘high’ and followed the procedure for assessment based on Ijaz et al,15 with modifications.13 16 We also considered the criteria described by Scottish Intercollegiate Guidelines17 and Critical Appraisal Skills Programme.18 We assessed eight domain: (1) recruitment procedure and follow-up, (2) exposure definition and measurement, (3) outcome definition and measurement, (4) inclusion of important age-dependent risk factors, (5) analysis method, (6) chronology, (7) funding and (8) conflict of interest. Each domain was characterised as having a low, high or unclear risk of bias (see online supplemental material for a detailed description). Domains 1–5 and 6–8 were major and minor domains, respectively. A study was evaluated as having an overall low risk of bias if all major domains had a low risk of bias.
Data synthesis
We evaluated studies using age categories and calculated the median of each of the age categories. If lower and upper categories were open ended, we used reasonable values based on the youngest and oldest participants included. For the younger open-ended age groups, we chose a lower boundary of 18 years if the population encompassed adults only. The median value of 18 years and the upper boundary of the lower open-ended age category was estimated. For the older open-ended age groups, an upper boundary of 95 years of age was chosen, and a median value was similarly calculated. However, these values were also modified in a sensitivity analysis. If studies only had risks of binary categories of age, such as >60 years versus ≤60 years, they were excluded from the meta-analysis. A log-linear model and a log-cubic model was constructed weighted for variance, and the Akaike Information Criteria (AIC) for each model was evaluated. A cubic model was evaluated to assess whether age effects reach a threshold at which at a certain age they accelerate. The log of the relative risk (RR) was then plotted against the age midpoints to assess linearity for the specific outcome studied, first for each individual study and then for all studies using categorised age. We wanted to assess whether: (A) there is an age threshold present at which the ln(RR) increases and (B) whether a log-linear relationship for the categorical studies would be a reasonable assumption. If a log-linear association could be assumed, a risk effect per year was obtained by using the generalised least squares for trend estimation of summarised dose–response data (glst).19 If the number of cases per age category was unknown, the risk estimate was obtained by variance-weighted least squares (vwls). If the log-linear association could be assumed, then the studies using categorical values were pooled with the ones using continuous values through a random-effects meta-analysis using the metan package.20 A similar procedure has been done before.15 21 If two studies investigated the same population, the study with the highest quality was chosen. ORs were converted to RRs using the formula proposed by Zhang et al22 when the prevalence in the reference group was greater than 10% to avoid an overestimation of the RRs.
We compared the pooled effects of studies using continuous values for age and those using categorical values. Sensitivity analyses were done to investigate the effect of risk of bias and study region of effect sizes and heterogeneity. Heterogeneity was assessed by I2 values, and publication bias was explored using Funnel plots and Egger’s test (metabias) if there were at least 10 studies. Stata V.14.2 (StatCorp) was used.
Assessment of the quality of the total body of evidence
We used the GRADE approach for grading the quality of the total body of evidence,23 following the example of Hulshof et al,24 with modifications.25 The quality of evidence was either high, moderate or low. Since only observational studies were included, the starting level was set to ‘moderate’. The quality was downgraded based on four factors: study limitations, indirectness, inconsistency, imprecision and publication bias. If study findings had large effect sizes, if there were dose–response relationships or if the presence of residual confounding was suspected (increasing the confidence in the association), the quality of evidence was upgraded. For the effect size evaluation, we considered the difference in risk due to age between a person entering adulthood (18 years) and the worldwide life expectancy (72 years),26 a difference of 54 years.
No ethical approval was needed for this study because data from previous published studies in which informed consent has been obtained by investigators was retrieved and analysed.
Results
After reviewing the 160 included primary studies from the umbrella review,14 we included 70 studies27–96 (figure 1). Online supplemental table S1 lists the excluded studies with reasons.
Except for Gu et al,51 a case control study, all studies were either retrospective or prospective cohort studies. Most originated from USA,34 while 14 studies came from Europe, 8 from Latin America (Mexico and Brazil), 10 from China, 2 from South Korea and 1 each from South Africa and Israel. Details on study characteristics are in online supplemental table S2.
In-hospital mortality
Forty-four studies investigating the risk of in-hospital mortality, meaning the risk of mortality in hospitalised patients, were included. Most studies were set in Western countries, such as USA (n=21), Europe (n=13) and Latin America (n=2). Six studies were set in China, one in South Africa and one in South Korea. Nineteen studies reported the risk of in-hospital mortality per age year, while the others used age categories to report the effect of age on risk. The results can be seen in online supplemental table S3. From the 44 studies, eight studies28 30 34 48 64 72 75 77 were assessed as having a low risk of bias. The majority had a high risk of bias because not all six age-dependent comorbidities were included in the model, while some used rough age categories in their models (greater than 10 years or a binary age category such as >60 years vs ≤60 years) (online supplemental table S4).
Thirty-one studies were included in the meta-analysis. Six studies27 37 58 65 67 83 were excluded because of the use of a binary age category, while one was excluded because the risk was reported by an age z-score, making it hard to compare with the other studies.81 Four studies were excluded from the main meta-analysis because they investigated mortality only on critically ill hospitalised patients or patients with COVID-19 cytokine storm.43 50 53 72 Two studies36 56 investigated the same study population, but Carter et al36 was chosen because this study had adjusted for more age-related risk factors. Likewise, Shi et al84 and Zhao et al95 used the same population. The former study was used because it reported age as a continuous factor, rather than a very rough age category. For the studies using age as categorical variables, the age and log of RR were modelled as linear and cubic relationships and plotted (online supplemental figure S3). Although the weighted cubic model had a lower AIC value (−71.8) than the weighted linear model (−62.5), the cubic model showed no evidence of a rapid increase in the slope at a specific age. At around age 70 years, there was a downturn in the slope, which did not follow the points, indicating a possible better fit with a fractional or higher level polynomial relationship. We assumed a log-linear relationship for simplicity, as at least for the ranges 20–70 years, there seemed to be no conflict with that assumption. A per-year effect was calculated for studies using age categories, and they were included in the meta-analysis.
The pooled RR for the 31 studies was 1.046 (95% CI 1.039 to 1.054) per age year (table 2). The funnel plot was asymmetric (online supplemental figure S4; Egger’s test p<0.0001), but the funnel plot using age as a continuous variable differed from the one using age derived from categories (online supplemental figure S5a,b). On closer look, the pooled RR of studies using age as a continuous variable (16 studies, 52%) was higher than the pooled RR of studies dividing age into categories (RRage continuous=1.057; 95% CI 1.047 to 1.067; RRage categories=1.037; 95% CI 1.028 to 1.046). Since the calculated midpoints from the age categories might be inaccurate, we hypothesised that the RR of studies using a higher number of age categories would be closer to the RRage continuous. Indeed, studies having more than four age categories had a pooled RR of 1.039 (95% CI 1.026 to 1.053), whereas studies with four or less age categories had a pooled RR of 1.030 (95% CI 1.020 to 1.041). We divided studies by age category width (5 vs 10 vs 10+ year intervals) and found that the effect estimate was lowest with studies using the widest age categories (10+ years RR=1.030; 95% CI 1.021 to 1.039), followed by studies using 10-year categories (RR=1.046; 95% CI 1.040 to 1.051). Only one study used a 5-year age category, having the highest estimate (RR=1.060; 95% CI 1.051 to 1.070). Because of probable bias using different age categories, further analyses for in-hospital mortality focused on studies using age as a continuous variable (table 2). The pooled RR did not differ by study quality. Studies from USA, Europe and South Korea had similar pooled RRs, whereas as the pooled RR for the Chinese studies was lower (RR=1.041; 95% CI 0.999 to 1.085). The unadjusted and adjusted RRs on studies reporting both values were similar (RRunadjusted=1.060, 95% CI 1.034 to 1.086; RRadjusted=1.059, 95% CI 1.037 to 1.081).
Results of pooled risks from meta-analyses
Case mortality
Fourteen studies investigating case mortality were included, in which mortality was ascertained in individuals who had tested positive for COVID-19. Five studies were from USA,52 54 61 90 92 three studies originated from Europe,34 78 79 three from Latin America35 86 87 and one each from China,51 South Africa33 and South Korea.66 The results can be seen in online supplemental table S5. Three studies (21%) were rated as having a low risk of bias. Most of the studies had a high risk of bias because they did not adjust for all age-dependent risk factors, the age categories were quite wide and the recruitment procedure indicated a possible selection bias (ie, such as recruitment of only symptomatic people or people who presented for care at hospitals without being hospitalised, or if ICD codes used for recruitment were not necessarily related to COVID-19) (online supplemental table S6).
Eleven studies were included in the meta-analysis, of which the majority used age categories (8 of 11). One study was excluded due to the use of binary age categories.87 One study54 reported the age year RR within age categories, and therefore, it was not possible to compare to the other studies. Two studies used the same study population,35 86 but Solís et al86 was chosen because the study had adjusted for more age-related factors and it had used a higher number of age categories.
The cubic model showed a relatively flat relationship between log(RR) and age from ages 40 to 85 years (online supplemental figure S6). Because both models had similar AIC values (linear: −157.4; cubic: −159.3), we assumed a linear model.
The meta-analysis resulted in a pooled RR of 1.074 (95% CI 1.061 to 1.087) per age year (table 2). The respective funnel plot showed asymmetry (online supplemental figure S7), although Egger’s test was not significant (p=0.320). The pooled RR of studies using continuous (RR=1.063; 95% CI 1.043 to 1.084) and categorical (RR=1.078; 95% CI 1.059 to 1.097) age variables differed. However, since the 95% CI values overlapped, there was no significant difference observed. We divided studies by age category width (5 vs 10 vs 10+ years intervals) and again found that the effect estimate was lowest with studies using the widest age categories (10+years RR=1.042; 95% CI 1.028 to 1.056; 10 years RR=1.080; 95% CI 1.057 to 1.103) and highest for studies using the most narrow age of 5 years (RR=1.094; 95% CI 1.082 to 1.107).
The high-quality studies had a higher RR per age than low quality studies (RRhigh quality=1.094, 95% CI 1.082 to 1.106; RRlow quality=1.069; 95% CI 1.056 to 1.083). European studies (n=3) had the highest pooled RR (RR=1.100; 95% CI 1.075 to 1.125), followed by USA studies (RR=1.061; 95% CI 1.075 to 1.125). Other regions had only one study, so a reliable comparison was not possible. The unadjusted and adjusted RRs on studies reporting both values were similar (RRunadjusted=1.079; 95% CI 1.062 to 1.097; RRadjusted=1.072; 95% CI 1.054 to 1.091).
Hospitalisation
A summary of the results of studies investigating risk of hospitalisation by age can be seen in online supplemental table S7. The study population typically used were individuals who were positive for COVID-19, some of which were hospitalised due to complications related to the infection. Sixteen studies were included, of which nine originated in the USA,29 38 47 52 63 76 77 91 96 three in Europe,34 78 79 three in Latin America35 49 85 and one in Israel.70 Four (25%) of the studies had a low risk of bias, and the reasons for high risk of bias were mainly the lack of adjustment for all predefined age-related risk factors and the use of binary or rough age categories (online supplemental table S8).
Of the 16 studies, 11 were included in the meta-analysis. Ebinger et al47 was excluded because the outcome was complex with reference categories that could not be compared with other studies (hospitalised/non-ICU vs ICU/non-intubated vs ICU/intubated). Carrillo-Vega et al35 and Giannouchos et al49 used the same study population, but the latter was used because the study had more age categories and adjusted for a higher number of age-related risk factors. Furthermore, two studies70 85 used binary age categories and one did not provide confidence intervals.63 Most studies (8 of 11) used age categories.
The results of the weighted linear and cubic models of studies using age categories are shown in online supplemental figure S8. Although the AIC values for the linear model were higher than for the cubic model (−57.2 vs −21.7), we did choose the linear model because of a lack of threshold where the rate increases with age and because the age range modelled appeared as a linear relationship.
The pooled RR for all studies was 1.034 (95% CI 1.021 to 1.048). The funnel plot looked asymmetric (online supplemental figure S9), but Egger’s test was statistically not-significant (p=0.439). The RR of studies using continuous and categorical age values were very similar (table 2), noting that most studies (63%) using age categories used more than four age categories. Again, using a finer age width increased the RR for studies using age categories (10+ years RR=1.024 95% CI 1.018 to 1.030; 10 years RR=1.040 95% CI 1.037 to 1.043; 5 years RR=1.056 95% CI 1.055 to 1.057) . The pooled effect for high-quality studies was higher than for low quality studies (RRhigh quality =1.051, 95% CI 1.040 to 1.061; RRlow quality=1.025; 95% CI 1.019 to 1.032). Moreover, the European studies had a higher pooled risk (RR=1.047; 95% CI 1.034 to 1.060) than the USA studies (RR=1.033, 95% CI 1.025 to 1.042), but the difference was not statistically significant. The unadjusted RR values were slightly higher than the adjusted values (RRunadjusted=1.045, 95% CI 1.026 to 1.065; RRadjusted=1.031, 95% CI 1.009 to 1.053).
Admission to ICU
Twelve studies investigated the effect of age on admission to ICU. Typically, the studies used hospitalised individuals as the study population and followed them up (retrospectively or prospectively). Eight studies originated in the USA28 55 61 64 77 82 88 96 and four were from China.32 46 51 89 A summary of the results can be seen in online supplemental table S9. Four (33%) of the studies were of high quality (low risk of bias). Similar to the other outcomes, the reasons for a high risk of bias were mainly due to the confounding domain, and to a lesser extent, to the exposure domain (rough age categories) (online supplemental table S10).
Eight studies were included in the meta-analysis. Du et al46 was not included. Due to the nature of its complex outcome, it could not be compared with other studies. Two studies evaluated the risk of ICU on individuals who had tested positive to COVID-19,51 96 and one study used a binary age category.88
The pooled RR for the studies was 1.006 (95% CI 0.999 to 1.013). Five studies (63%) used age as a continuous variable, and these studies had only a slightly lower RR (1.003; 95% CI 0.996 to 1.010) compared with the ones using age as a categorical value (RR=1.013; 95% CI 0.998 to 1.028), but still the effect was statistically not-significant for both. The high-quality studies had a slightly lower RR than the low quality studies (RRhigh quality=1.004, 95% CI 0.996 to 1.013; RRlow quality=1.011; 95% CI 0.996 to 1.026), but again both estimates were not statistically significant (table 2).
Mechanical ventilation (intubation)
Seven studies investigated the effect of age on the risk of intubation, using individuals hospitalised due to COVID-19. All studies were set in the USA,42 55 74 82 88 91 and a summary of the results can be seen in online supplemental table S11. No studies had a low risk of bias (high quality), either due to the ‘confounding’ or ‘exposure assessment’ domain (online supplemental table S12). Half of the studies used age categories, and the effect estimate was similar for studies using a continuous and a categorical age variable. One study88 was excluded from the meta-analysis because it used a binary category for age. The pooled RR showed a very weak statistically not-significant increase in risk per age year (RR=1.006; 95% CI 0.995 to 1.018) (table 2).
Quality of evidence
Since only observational studies were included, the initial level of evidence was set at ‘moderate’.
After decreasing a level for unclear publication bias, and increasing two levels for dose–response effect and two levels for a large effect estimate, the overall certainty of evidence was high for both risk of in-hospital mortality and case mortality. For hospitalisation, after downgrading for high inconsistency and unclear publication bias, and upgrading for dose response, effect estimate and effect size, the overall certainty of evidence was high (table 3).
Assessment of evidence for the risk of studied outcomes based on Grades of Recommendations, Assessment, Development, and Evaluation framework
There was no statistically significant effect observed for admission to ICU and intubation. Hence, these outcomes were not included in the assessment.
Discussion
An increased age-related risk of COVID-19 in-hospital mortality, case mortality and hospitalisation of 5.7%, 7.4% and 3.4% per age year, respectively, was observed, with a high quality of evidence. Furthermore, there was no evidence of an age threshold at which the risk of disease severity increased, with the age effect appearing to be linear. The association between age and both ICU admission and mechanical ventilation was weak and not statistically significant. Although effects varied slightly by region, there were no obvious trends observed.
Our results for case mortality are in agreement with a review that found a log-linear association between age and infection fatality rate but that did not include comorbidities in their analysis.9
Strengths and limitations
To our knowledge, since our rapid review published,13 this is the first systematic review primarily focused on estimating the isolated effect of age on the risk of COVID-19 disease severity, including case and in-hospital mortality, hospitalisation, ICU admission and intubation. It encompasses 70 primary studies with data from more than 400 000 participants and includes only studies adjusting for important age-related factors associated with COVID-19 disease severity.14 Adjusting for comorbidities allows to explicitly ‘factor out’ the mediating effect of comorbidities in order to get the isolated effect of age, or the risk presented by a person of a given age who has no pre-existing conditions.
The results in this review should be considered in light of its limitations. For studies reporting age as a categorical value, since the age categories used in the studies could not be compared because of their heterogeneity, the median of the age category represented the age for the reported effect size. This procedure could have led to inaccuracies of the effect size. This was evident in that effect sizes increased when using finer age categories, indicating that the use of wide age categories most likely leads to an underestimation of the age effect. We reported the pooled effect sizes for studies using age as a continuous variable for the outcome in-hospital mortality. For the other outcomes, we reported the pooled effect size for studies using categorical and continuous age variables together since their effect was similar.
The funnel plots were asymmetrical, which was especially obvious for in-hospital mortality, where half of the studies used age as a categorical variable. However, funnel plot asymmetry has other possible causes besides publication bias.97 In this case, we believe that the cause is due to the heterogeneity of the exposure, namely when using studies with age as categorical variables. This was indeed shown when plotting funnel plots separately for studies using continuous and categorical age variables. The studies using continuous variables did not show obvious asymmetry in the funnel plots, while the studies using categorical age variables did show asymmetry. However, they had a narrow range of standard errors, which is also a contraindication for using funnel plots.97 98 Even though we downgraded for publication bias in our GRADE evaluation, the overall assessment of evidence was still rated as high.
The adjusted effect estimates were only slightly lower than the unadjusted estimates, or at least the difference was not as great as observed in our previous rapid review. An explanation could be a potential interaction effect between age and certain chronic diseases, or a possible selection effect. This was observed in the related umbrella review by Treskova-Schwarzbach et al14 and the review by Mesas et al,99 where younger individuals who had heart failure and kidney disease had a higher risk of in-hospital mortality compared with the risk observed in older individuals. This effect was also seen for hypertension.99 It may be that older patients are more quickly admitted to the hospital with less severe concomitant diseases than younger patients, which may be reflected as an increased in-hospital mortality for younger patients, essentially due to a selection effect in the hospital admission.
There was no increased risk by age year for being admitted to the ICU or for mechanical ventilation, but this result is hard to reconcile, given the strength of association between age and mortality. The included studies mostly occurred during the first and second waves, when ICU capacity was limited. How this lack of association is due to the possibility of triage in some scenarios is unknown but worth considering.
Although the studies included in the meta-analyses included a diverse set of countries, only a few studies focused on developing countries. However, some of the hardest hit countries (such as Mexico and Brazil) were included in the analysis. Lastly, most of the primary studies included were done in the first or second wave of the pandemic, and new mutations that may affect the association between age and disease severity were not considered.
Methodological quality of the included studies
Although high-quality studies were present for every outcome except mechanical ventilation, low-quality studies dominated. The heterogeneity in quality of the studies may be problematic for the meta-analysis, but we tried to gauge this in the sensitivity analyses. High-quality studies had the same effect estimate as low-quality studies for in-hospital mortality, but for case mortality and hospitalisation, low-quality studies underestimated the isolated effect of age. The main reason for a low risk of bias was the lack of adjustment for all age-related risk factors in the domain ‘confounding’. Moreover, considering the ‘recruitment’ domain, some studies included participants who used clinical symptoms as a COVID-19 case, which is less accurate than a RT-PCR test. It should be mentioned that the recruitment domain could have potentially been high risk for most studies, as in the early stages of the pandemic, RT-PCR testing was relatively scarce and only individuals with symptoms or who had direct contact with a positive person were tested in some countries. Furthermore, some studies used rough age categories that will lead to an inaccurate risk effect. Lastly, some studies corrected for biomarkers or factors (such as fever, d-Dimer level and lymphocyte count) that reflect disease severity. When studying associations between disease severity and age and chronic factors, using such markers in the model should be avoided to avoid overadjustment.
Implications for practice, policy and future research
During the COVID-19 pandemic, it is necessary to accurately define risk groups for COVID-19 disease severity when implementing contact or work restrictions. This review shows that increased age year is associated with mortality and hospitalisation, and an age threshold for which there is a marked increase in risk was not apparent. Therefore, targetting persons above a certain (arbitrary) age threshold is not recommended in the workplace, as it may lead to ageism, permeating in the community and in the workplace.100 If workers older than 60 years are not allowed to perform a work task because of perceived higher risk of disease severity starting at that age, it is difficult to argue why a person can still perform that activity at age 59 years but must stop it or needs special protection on their 60th birthday. Rather, individualised risk profiles could be made by considering a continuous increase in risk by age-year.
Using scores that also consider parameters such as pre-existing conditions may be feasible, depending on the setting. If a company doctor is present, a diagnosis transfer to the employer should be excluded as a rule. However, a company doctor is not always available in the work setting. Thus, there may be complexities for score applications at the workplace, since the privacy of the employee with regards to health disclosures is also a priority.
Contrary to workplace restrictions, the use of an isolated, per-age year increase when prioritising vaccinations is not recommended. Government agencies often divide the population in age groups, but this categorisation is not purely about age-related effects. Rather, the high-age groups always include a higher proportion of individuals with pre-exisiting conditions. In this respect, our result of an approximately linear increase in isolated age risk cannot be used as an argument against the definition of vaccination prioritisation groups.
This comprehensive review contradicts our previous rapid review,13 which encompassed mainly Chinese studies and indicated a weak influence of age on COVID-19 disease severity. This highlights the need for continuous, ‘living’ reviews of the available evidence throughout the pandemic, as results may change due to more available evidence available or to new variants affecting the association between age and disease severity. Furthermore, as there are hints of possible effect modifications between age and certain chronic diseases,14 future studies should focus on quantifying these interactions.
Conclusions
A best-possible quantification of the increase in COVID-19 disease severity due to age was achieved. Age-related workplace prevention programmes should consider the continuous increase in risk, rather than implementing age thresholds. There is a need for continuous, high-quality research to characterise age associations with disease severity in light of new variants.
Data availability statement
All data relevant to the study are included in the article or uploaded as supplementary information. The data used was extracted from primary studies and are available in the full text or supplementary material.
Ethics statements
Patient consent for publication
Acknowledgments
Our heartfelt thanks to Dr Thomas Harder and Dr Marina Treskova from the Robert Koch Institute for their recommendations and for giving us access to their study database.
References
Supplementary materials
Supplementary Data
This web only file has been produced by the BMJ Publishing Group from an electronic file supplied by the author(s) and has not been edited for content.
Footnotes
Handling editor Seye Abimbola
Contributors KRS, AS, GP-H and AN were involved in project development, including methodology. KRS, GP-H, DR and SS participated in study selection process, data extraction and risk of bias evaluation. KRS performed analyses, including meta-analyses and Grades of Recommendations, Assessment, Development, and Evaluation evaluation together with AS. KRS provided first draft of manuscript, and all authors were involved in the review and editing of that draft to create a final draft. AS is the guarantor of this work.
Competing interests None declared.
Provenance and peer review Not commissioned; externally peer reviewed.
Supplemental material This content has been supplied by the author(s). It has not been vetted by BMJ Publishing Group Limited (BMJ) and may not have been peer-reviewed. Any opinions or recommendations discussed are solely those of the author(s) and are not endorsed by BMJ. BMJ disclaims all liability and responsibility arising from any reliance placed on the content. Where the content includes any translated material, BMJ does not warrant the accuracy and reliability of the translations (including but not limited to local regulations, clinical guidelines, terminology, drug names and drug dosages), and is not responsible for any error and/or omissions arising from translation and adaptation or otherwise.