
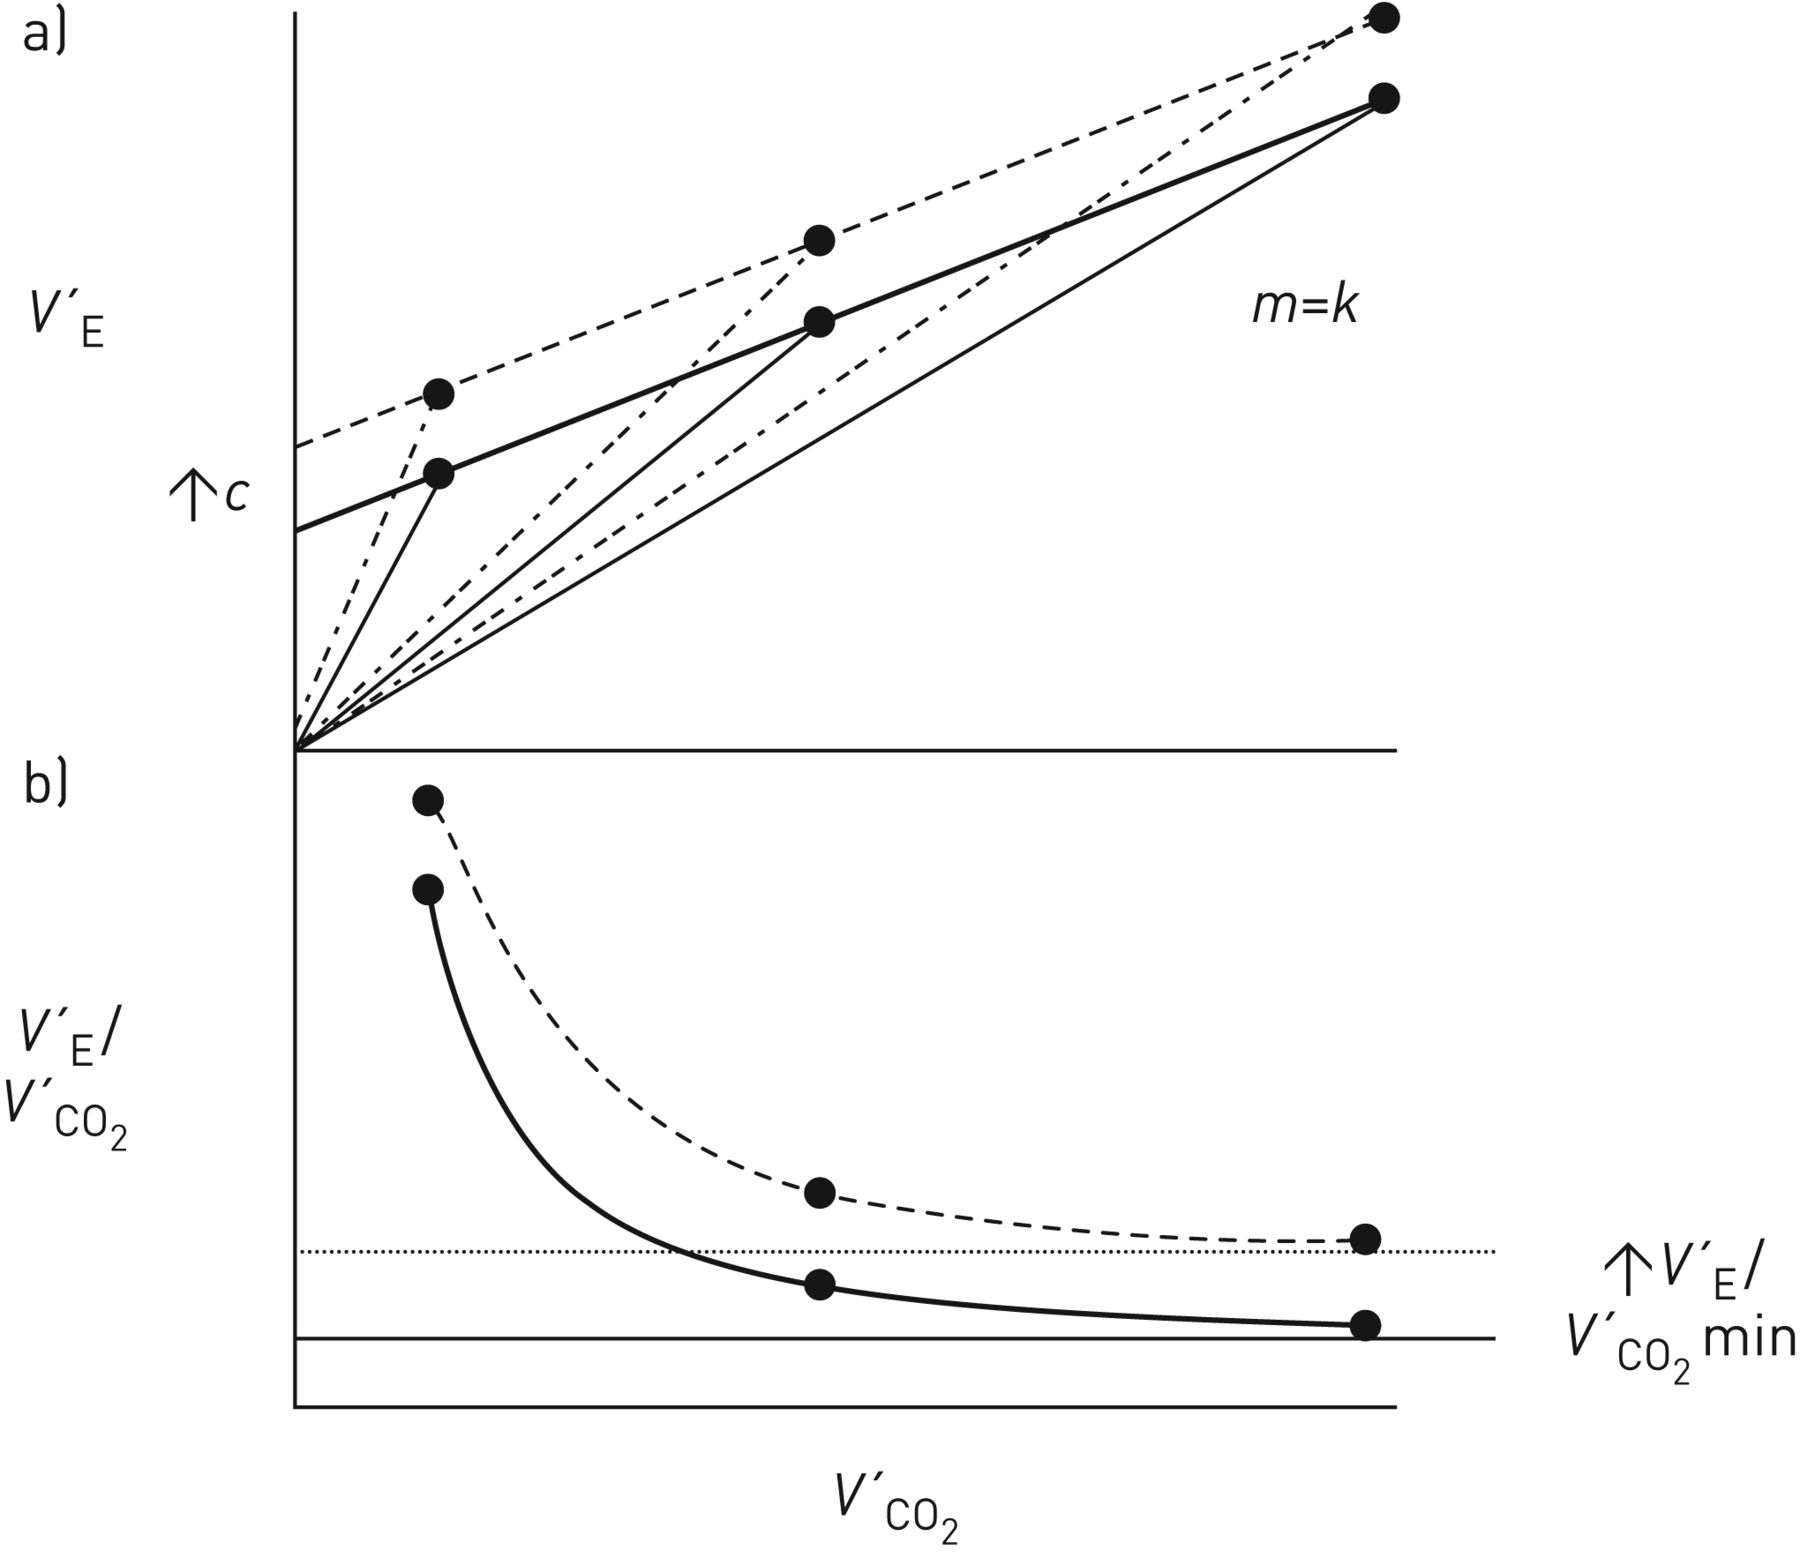
FIGURE 4
Schematic representation of a) the effects of a hypothetical intervention that increased the V′E-intercept (c) with no change in the V′E–V′CO2 slope (m) on ventilation (V′E) and b) ventilatory equivalent for CO2 (V′E/V′CO2) as a function of CO2 output (V′CO2) during rapid-incremental or ramp exercise for work rates where arterial CO2 tension (PaCO2) is assumed to be stable. Solid profiles: pre-intervention; dashed profiles, post-ntervention.