


Abstract
“Ventilatory efficiency” is widely used in cardiopulmonary exercise testing to make inferences regarding the normality (or otherwise) of the arterial CO2 tension (PaCO2) and physiological dead-space fraction of the breath (VD/VT) responses to rapid-incremental (or ramp) exercise. It is quantified as: 1) the slope of the linear region of the relationship between ventilation (V′E) and pulmonary CO2 output (V′CO2); and/or 2) the ventilatory equivalent for CO2 at the lactate threshold (V′E/V′CO2 ) or its minimum value (V′E/V′CO2min), which occurs soon after
  but before respiratory compensation. Although these indices are normally numerically similar, they are not equally robust. That is, high values for V′E/V′CO2
 and V′E/V′CO2min provide a rigorous index of an elevated VD/VT when PaCO2 is known (or can be assumed) to be regulated. In contrast, a high V′E–V′CO2 slope on its own does not, as account has also to be taken of the associated normally positive and small V′E intercept. Interpretation is complicated by factors such as: the extent to which PaCO2 is actually regulated during rapid-incremental exercise (as is the case for steady-state moderate exercise); and whether V′E/V′CO2
 or V′E/V′CO2min provide accurate reflections of the true asymptotic value of V′E/V′CO2, to which the V′E–V′CO2 slope approximates at very high work rates.
Abstract
The efficiency of CO2 clearance at the lungs in exercise is estimated from the relationship between ventilation and CO2 elimination rate. It is compromised in lung and cardiovascular disease, stressing breathing and shortness of breath, and therefore impairing exercise capacity. https://bit.ly/3gYY866
Introduction
“Ventilatory efficiency”, the ventilation (V′E) associated with eliminating a given level of metabolically produced CO2 as pulmonary CO2 output (V′CO2), is a construct that has evolved from the discipline of cardiopulmonary exercise testing (CPET), whereby the integrated system function of muscle metabolism, the circulation and heart, pulmonary gas exchange and ventilation are interrogated and monitored in real time (typically breath-by-breath) by means of a rapid-incremental or ramp exercise test [1–3]. Fundamental to any mechanistic consideration of ventilatory efficiency is that V′E during moderate exercise (i.e. below the lactate threshold,  ; i.e. estimated, rather than directly measured), with work rates not eliciting a sustained metabolic acidosis) operates as if it is coupled to the requirement for clearing the associated endogenous CO2 load accruing from aerobic metabolism, to regulate arterial CO2 tension (PaCO2) at or close to its resting value (reviewed in [4–8]). Exactly how this apparently CO2-linked control is mediated remains tantalisingly elusive, however, not the least because of the absence of a significant sustained PaCO2 error signal that could stimulate the carotid body and central chemoreflexes (reviewed in [6–8]). It had been suggested that V′E is driven, largely if not entirely, by the “CO2 flow to the lungs”, i.e. the product of venous return and the mixed-venous CO2 content [9]. Subsequently, a logical imprecision in this reasoning was identified by Whipp [10]: “Such proposals, however, fail to meet the PaCO2-regulatory demands of the control. That is, any such control link will depend not on the rate at which CO2 is brought to the lung per unit time but that minus the rate at which CO2 leaves the lung in the pulmonary arterial blood”. The precise substrate of such a CO2-linked mechanism has, to date, remained obscure.
It is important to recognise that PaCO2 regulation during moderate exercise is expressed through the transform not only of the proportional matching of V′E to V′CO2 but also of the physiological dead space fraction of the breath (VD/VT) [7, 8, 10]: (1)where 863 is the constant that corrects for the different conditions of reporting gas volumes (standard temperature and pressure, dry; body temperature and pressure, saturated) and transformation of fractional concentration to partial pressure; and V′E/V′CO2 is the ventilatory equivalent for CO2.
At higher work rates engendering a metabolic (largely lactic) acidosis, V′E has the further imperatives of a) clearing the additional CO2 resulting from bicarbonate-buffering of the metabolic acidosis and b) generating respiratory compensation to constrain the falling arterial pH (pHa) [5, 7, 8, 11–14]. This can usefully be expressed through a modification of the Henderson–Hasselbalch equation (i.e. pH=pK+log[HCO3−]/α·PaCO2) by substituting for PaCO2 from equation 1: (2)where pK′ is the negative logarithm of the carbonic acid ionisation constant; [HCO3−]a is arterial bicarbonate concentration; and α is the CO2 solubility coefficient (0.03 mmol·mmHg−1 )). The bracketed terms represent (from left to right): metabolic acid–base “set-point”, “ventilatory control” and pulmonary gas-exchange “efficiency” operators [8]. Thus, the effectiveness of respiratory compensation depends not only on V′E/V′CO2 increasing absolutely, but also relative to VD/VT.
The V′E–V′CO2 relationship
The significance of PaCO2 and VD/VT in setting the V′E requirements during exercise is illustrated by re-arranging equation 1 in terms of V′E: (3)which, when viewed at level of the alveolar gas-exchange process, simplifies to:
 (4)where V′A is alveolar ventilation.
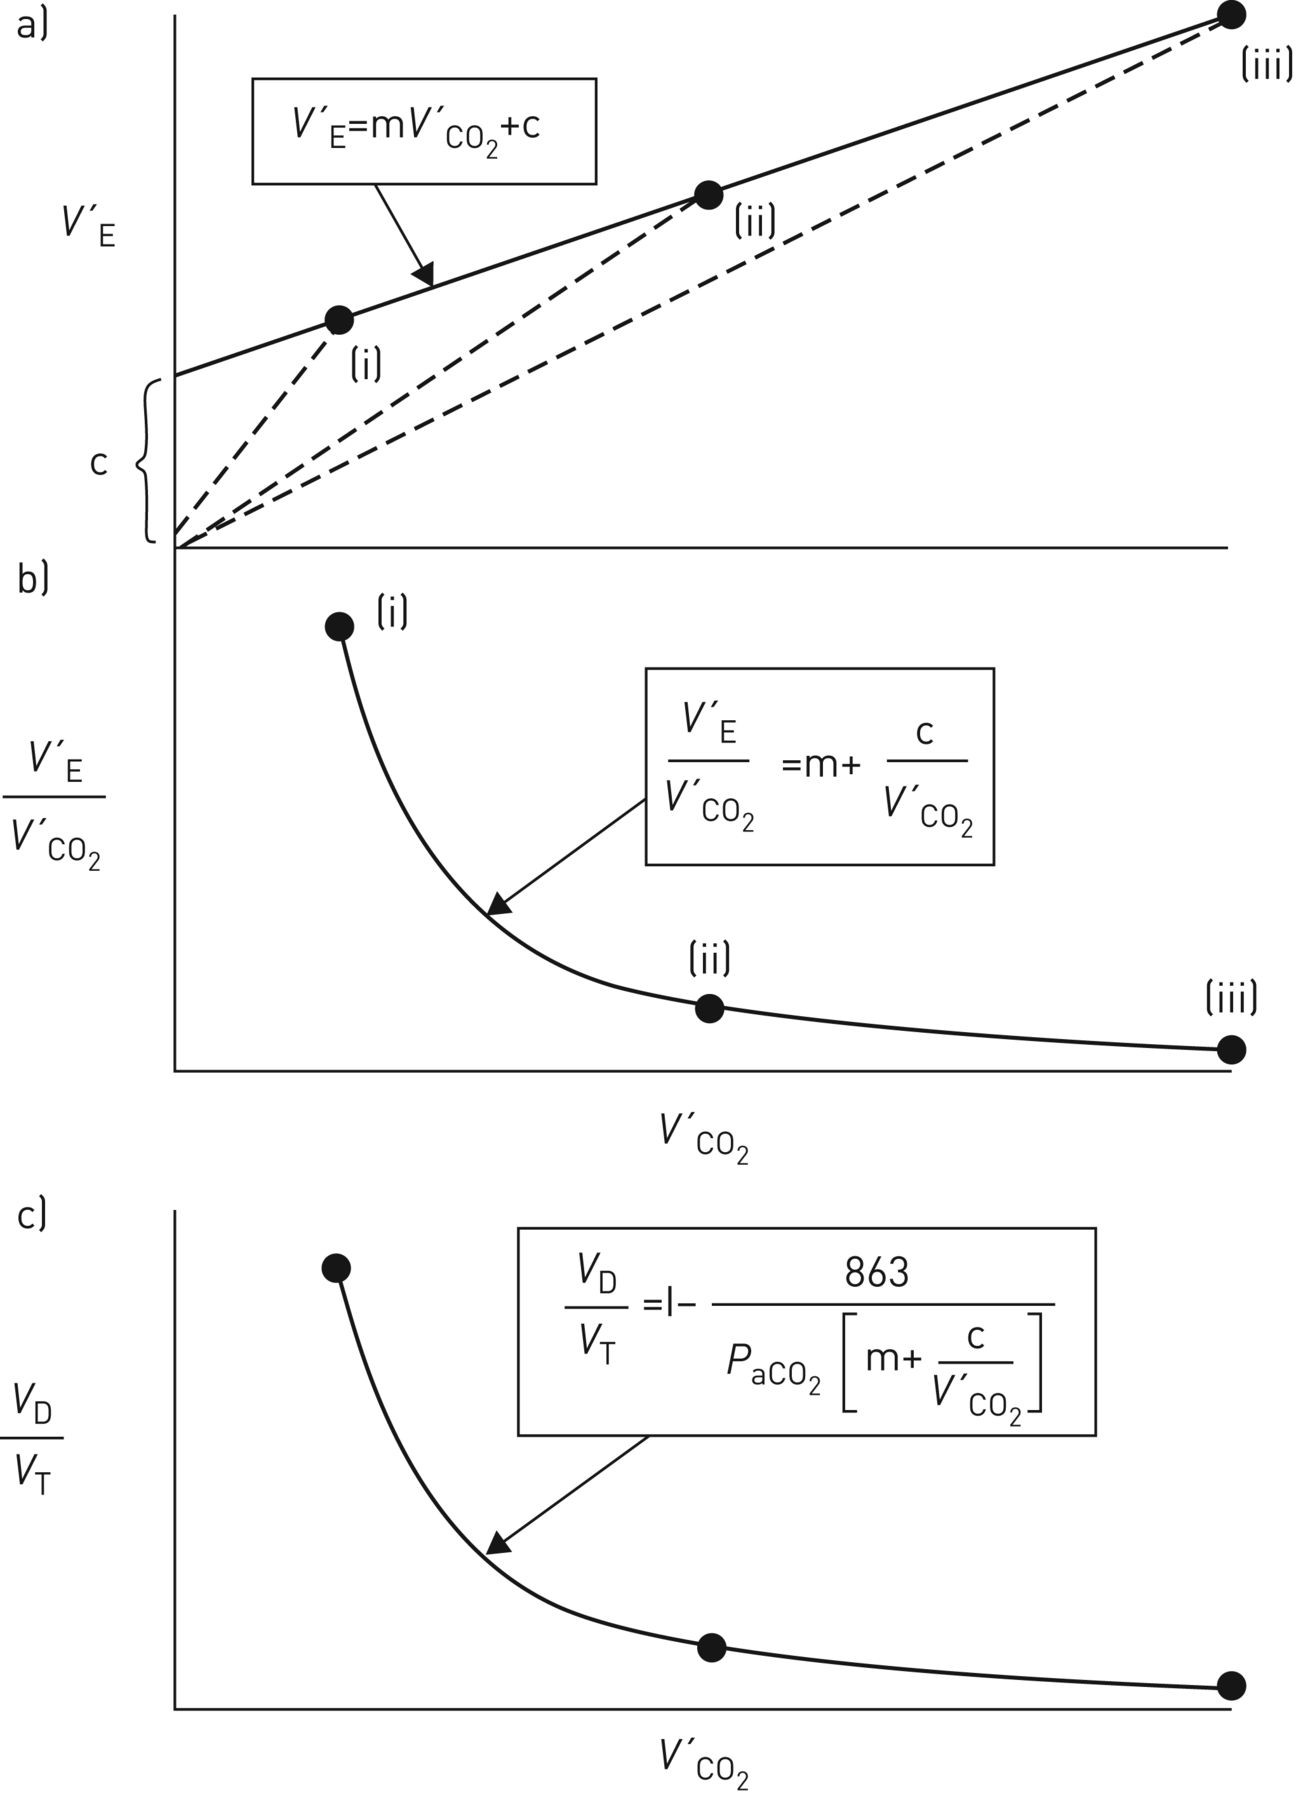
Over a wide work-rate range, expressing V′E as a function of V′CO2 normally results in a linear relationship (figure 1a): (5)where m is the slope (i.e.ΔV′E/ΔV′CO2, normally ∼25 when reported in the same units, e.g. L·min−1, mL·min−1 etc., with V′E being reported as body temperature and pressure, saturated and V′CO2 as standard temperature and pressure, dry), and c is the V′E intercept (normally ∼3–5 L·min−1) when allowance is made for breathing apparatus (valve or facemask) dead space [17–19], i.e. by subtracting the product of apparatus VD and breathing frequency from the measured V′E. Without this correction, the V′E intercept will be over-estimated, to a degree that naturally depends on the size of the apparatus VD.

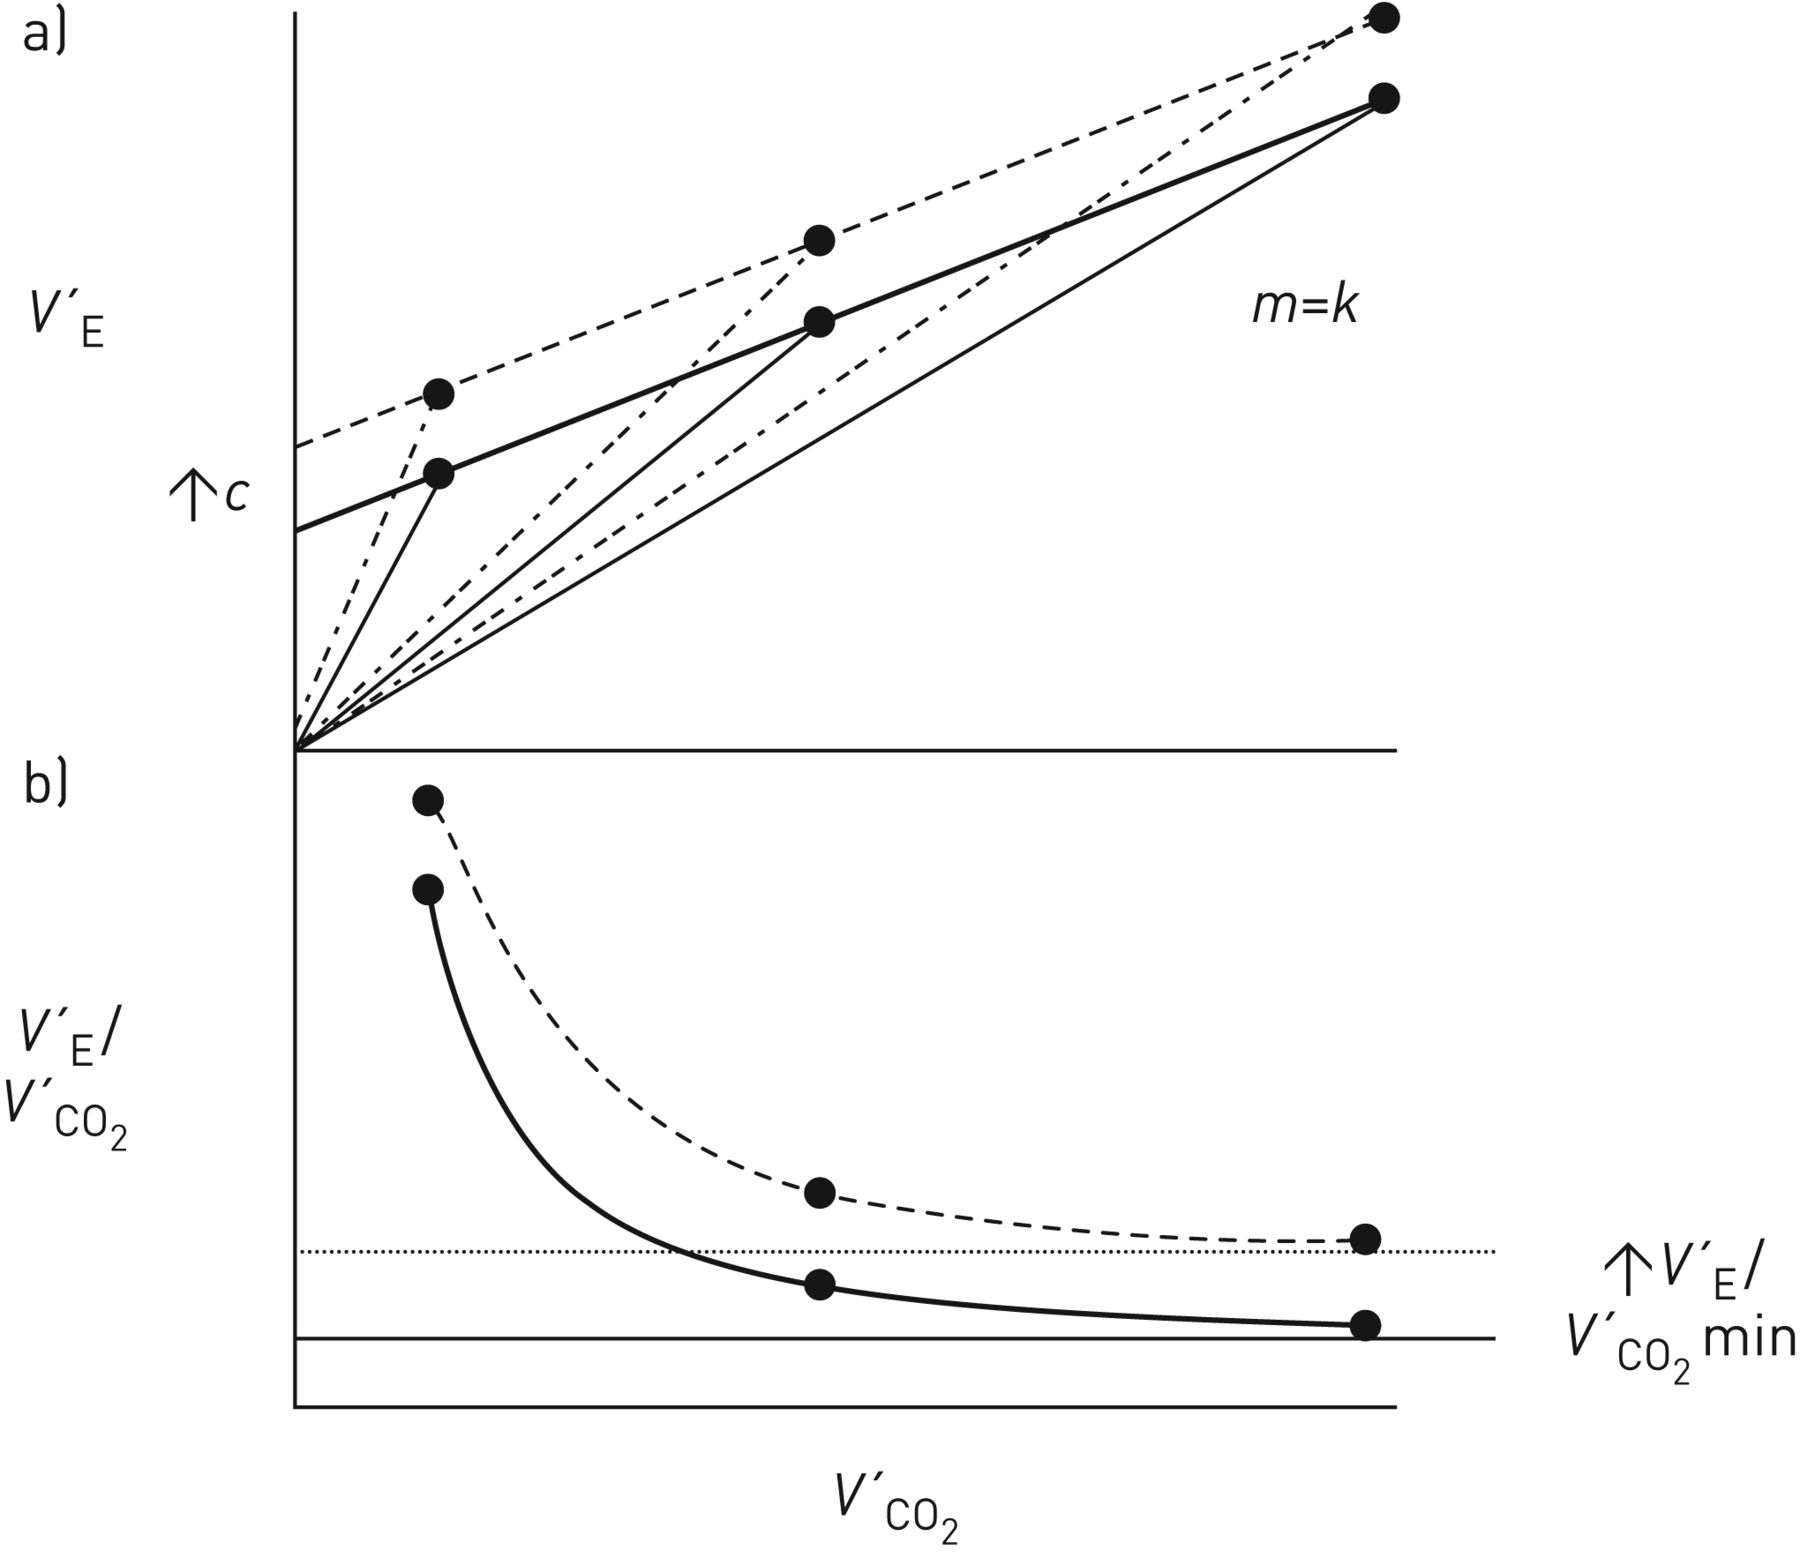
Schematic representation of a) ventilation (V′E), b) ventilatory equivalent for CO2 (V′E/V′CO2) and c) physiological dead space fraction of the breath (VD/VT) as a function of CO2 output (V′CO2) during rapid-incremental (or ramp) exercise for work rates where arterial CO2 tension (PaCO2) is assumed to be stable. m: V′E–V′CO2 slope; c: V′E intercept. Modified with permission from a, b) [15] and c) [16].
Encapsulated in m are the composite response profiles of PaCO2 and VD/VT, while c is the value of V′E at a hypothetical V′CO2 of zero. And as the V′A–V′CO2 relationship is normally also linear but intersects the origin (i.e. no V′A intercept) [20], the corresponding relationship between dead space ventilation (V′D) and V′CO2 has also to be linear, with a V′D intercept equal to c.
For the rapidly changing work-rate protocols used in CPET, the range of V′E–V′CO2 linearity actually extends beyond  . That is, the onset of respiratory compensation for the metabolic acidosis (the respiratory compensation point (RCP)) is delayed relative to the onset of the acidosis itself, i.e. at
  (figure 2) [7, 8, 14, 21–24]. As a result, V′E continues to remain coupled to V′CO2, providing a supra-threshold region of PaCO2 stability (termed “isocapnic buffering”, in a physiological rather than a physicochemical sense) [25]. In contrast, for slow-incremental and steady-state exercise tests,
  and the RCP are coincident. The slow response dynamics of the compensatory hyperventilation, in the context of rapid work-rate incrementation rates, has been suggested to reflect the carotid body chemoreceptors having an amplitude or time-related threshold for metabolic H+ detection [8], possibly expressed through slow intracellular expression of the metabolic acidosis and/or slow subsequent signal transduction at H+-sensitive type I TASK-1 potassium channels [26, 27]. The RCP is thus a manifestation of H+-related ventilatory control (and is therefore not a metabolic construct). For example, the RCP becomes closer to
  when carotid chemoreflex drive is enhanced by the imposition of hypoxia [28–30] but farther from
  when the work rate is incremented more rapidly [29–31].
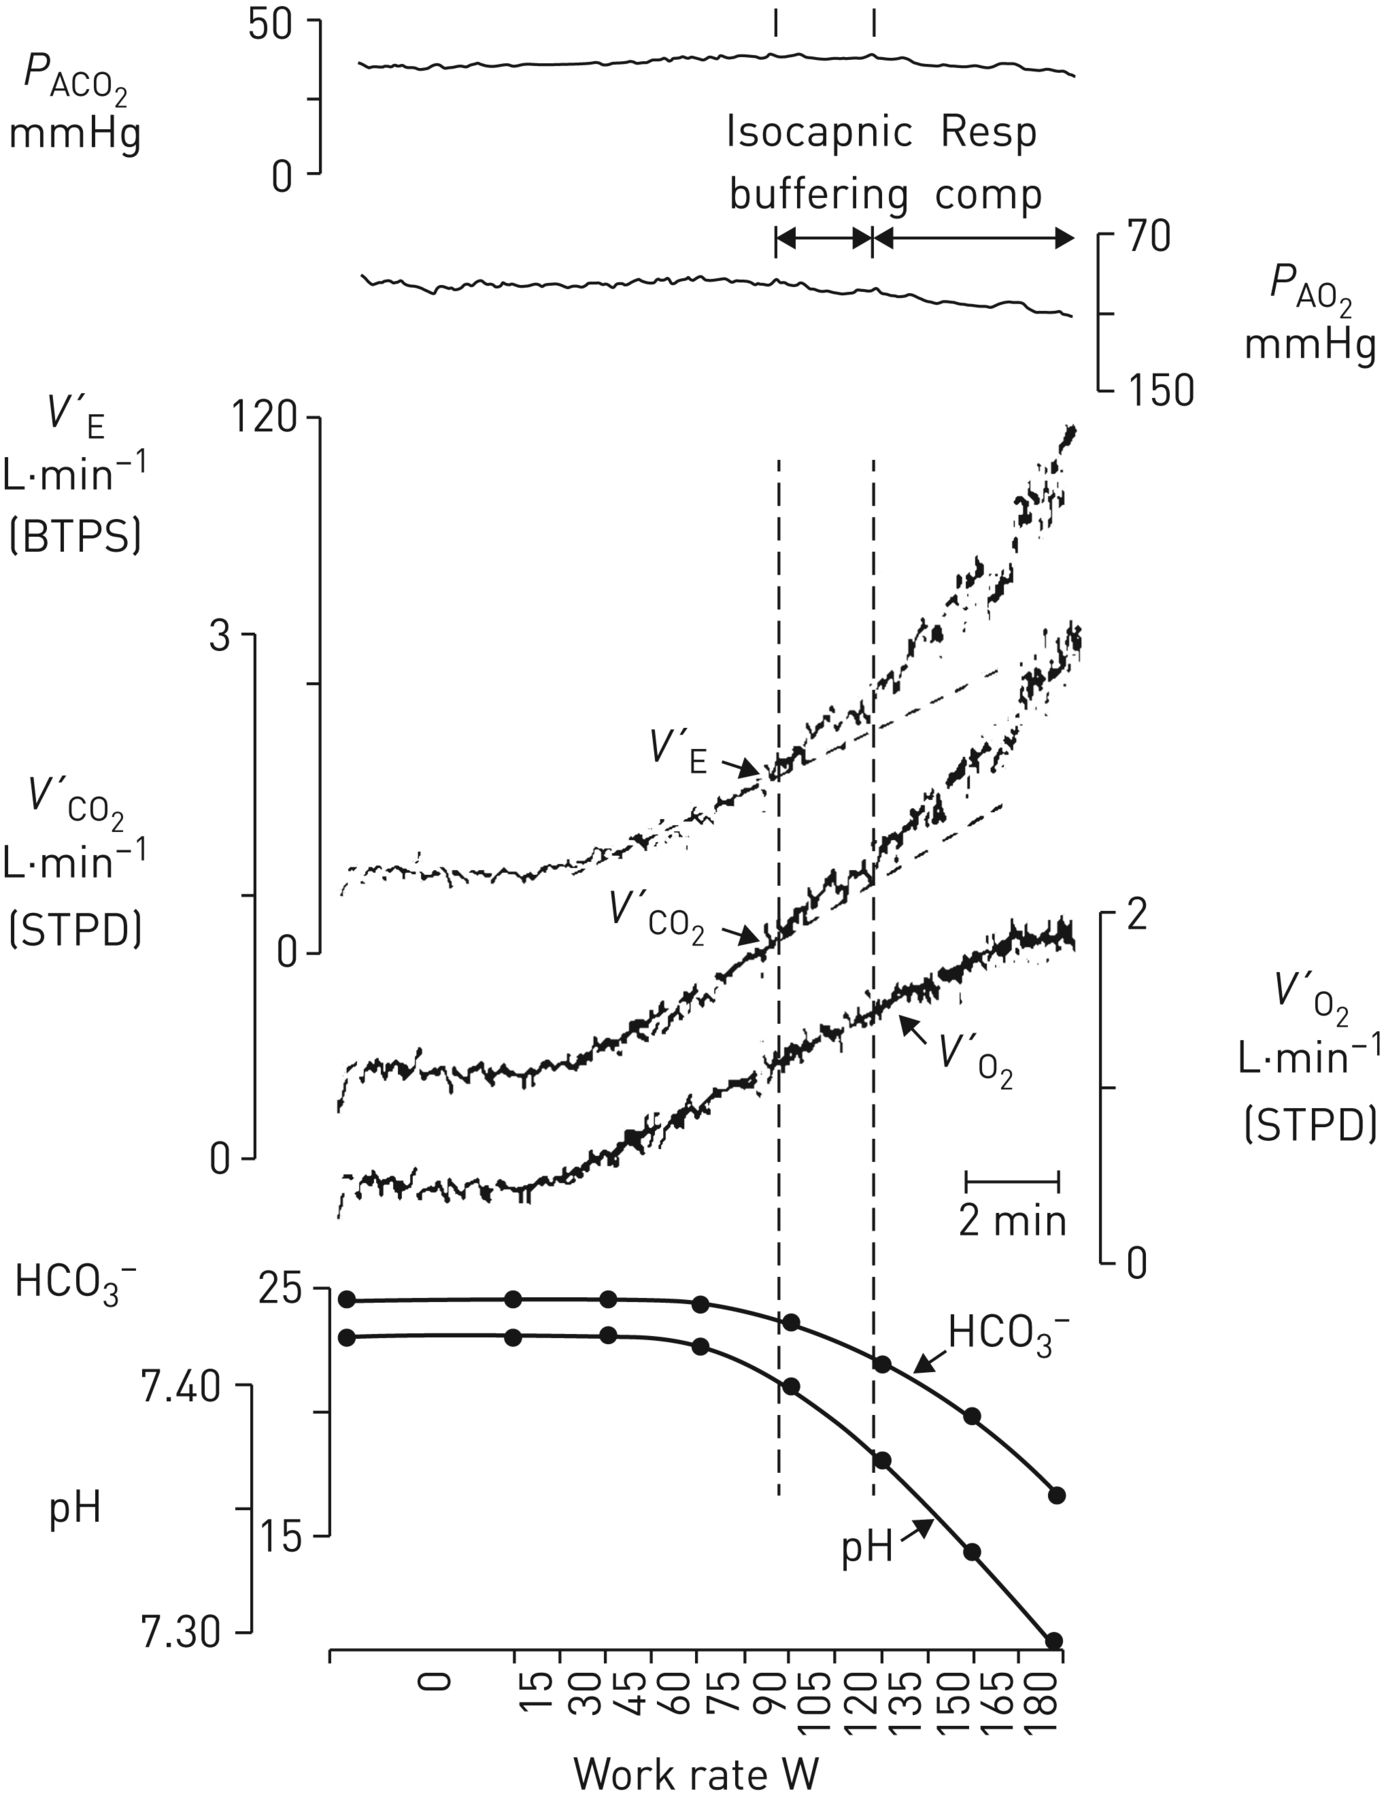
Alveolar end-tidal PCO2 and PO2 (PACO2, PAO2), ventilation (V′E), CO2 output (V′CO2), O2 uptake (V′O2), arterial [HCO3−] and arterial pH as a function of work rate for a rapid-incremental cycle-ergometer exercise test. The lactate threshold occurs when arterial [HCO3−] starts to buffer the metabolic acidosis, evidenced in the accelerating V′CO2 response (left vertical dashed line). As V′E continues to respond in proportion to V′CO2, it therefore increases out of proportion to V′O2, and PAO2 therefore begins to rise. PACO2 remains stable until respiratory compensation for the metabolic acidosis develops (right vertical dashed line; isocapnic buffering). Beyond this point, V′E increases at a greater rate than V′CO2, and PACO2 therefore starts to decreases (respiratory compensation). Reproduced with permission from [3].
The V′E/V′CO2 response
V′E/V′CO2 can be viewed as a variable “derived” from the V′E–V′CO2 relationship; being numerically equal to the slope of a hypothetical line joining a given V′E, V′CO2 point to the origin (dashed lines in figure 1a). The linearity of the V′E–V′CO2 relationship and its positive V′E intercept (figure 1a; equation 5) requires V′E/V′CO2 to decline hyperbolically as work rate and therefore V′CO2 increase (figure 1b). Over a considerable portion of the tolerable work-rate range, V′E/V′CO2 clearly exceeds the V′E–V′CO2 slope (m), specifically by the variable factor c/V′CO2: (6)As c/V′CO2 diminishes with increasing work rate (and V′CO2), V′E/V′CO2 will decline to achieve an asymptotic value at high levels of V′CO2 that is equal to m (figure 1b) [15, 17, 32].
“It is important, therefore, that if the values of the ventilatory equivalent for CO2 are to be used for characterising a subject's ventilatory response to exercise they should be reported together with the values of V′CO2 at which they were obtained. Or, better still, both the slope and intercept parameters of the V′E–V′CO2 relationship should be defined” [15]. And it should also be noted that V′E/V′CO2 will equal m not only at very high V′CO2 values, but also when the V′E/V′CO2 relationship extrapolates to the origin (i.e. when c=0) (equation 6) [18, 19].
Equation 1 indicates that maintained regulation of PaCO2 requires the response profiles of V′E/V′CO2 and VD/VT to be qualitatively and quantitatively matched. That is, the normal hyperbolic decline of V′E/V′CO2 with increasing work rate (figure 1b) necessitates a similar profile of VD/VT decline (figure 1c) [10, 15, 29]: (7)Substituting V′E/V′CO2 for m+c/V′CO2 from equation 6 into equation 7, and re-arranging in terms of V′E/V′CO2, yields:
 (8)A modest contribution to the declining VD/VT with increasing work rate derives from a more-even perfusion of the lungs (Q′) that results in an improved V′A/Q′ distribution [33–36]. However, the predominant influence is the consequence of disproportionate increases in VD and VT; the former being less than the latter. This reflects the compliance of the conducting airways being appreciably less than that of the alveoli.
As for the V′E–V′CO2 relationship, the resulting VD–VT relationship is normally also linear with a positive VD intercept [34] which confers hyperbolicity on the VD/VT decline. Were VD/VT not to decline hyperbolically, a necessary consequence would be the introduction of nonlinearities into the V′E–V′CO2 relationship or PaCO2 not being regulated, or both [15], unless, of course, the V′E intercept were to be zero (equations 7 and 8). In this latter situation, therefore, VD/VT will not decline with increasing work rate and, if PaCO2 remains regulated, neither will V′E/V′CO2.
Exactly how such apparent matching between V′E/V′CO2 and VD/VT might be mediated has yet to be resolved, but “the system seems to “know” that when VD/VT is reduced (making V′E more efficient with respect to V′A) V′E “needs” to increase less per unit V′CO2 to effect its regulatory function, with the necessary logical assumption, of course, that there is such regulation. But unless one is badly confusing subsequence and consequence, it is hard to believe, in the light of the evidence cited above, that there is not.” [10].
Ventilatory efficiency indices
The V′E–V′CO2 and V′E/V′CO2 response profiles provide indices of ventilatory efficiency [1–3] as, respectively, a) the slope of the linear region of the V′E–V′CO2 relationship (i.e. normally up to the RCP) (figure 1a and b) either V′E/V′CO2 at  (V′E/V′CO2
 ) or its minimum value (V′E/V′CO2min) typically occurring soon thereafter
  but before the RCP (figure 1b), and have been shown to be essentially indistinguishable in healthy individuals [19]. When these several indices are increased relative to normal, ventilatory efficiency is assumed to have decreased (i.e. greater ventilatory inefficiency).
As V′E/V′CO2 min approximates the V′E–V′CO2 slope at very high V′CO2 values (figure 1a and b) [10, 15, 32], these two indices are essentially equal in fit individuals for whom  and the RCP occur at relatively high absolute values of V′CO2 [19, 37]. Interestingly, slightly higher values for ventilatory efficiency have been reported with ageing [19], and also in females compared to males [19, 37]. Ventilatory efficiency indices have been reported by some to be unaffected by exercise modality (i.e. cycle ergometer versus treadmill) [19], although others report slightly higher values for treadmill exercise in females [38] and in males [39]. Finally, there is some question as to whether test–retest reliability differs between ventilatory efficiency indices, being reported either to be greater for V′E/V′CO2min than for the V′E/V′CO2 slope [19] or not to differ [37].
Interpretation of abnormally high values for ventilatory efficiency does require some care, however, recognising that this could reflect impairments in VD/VT or PaCO2 regulation, or both. For example, higher-then-normal values of V′E–V′CO2 slope and V′E/V′CO2 min could reflect a low PaCO2 (reflective of a high ventilatory control “gain”, as with hyperventilatory conditions such as arterial hypoxaemia, metabolic acidaemia and increased central neural respiratory drive), a high VD/VT (reflective of increased V′A/Q′ mismatch, as in the healthy elderly and lung and cardiovascular disease patients) or both. In addition, a high V′E/V′CO2 min might be expected in individuals having a low respiratory quotient (i.e. with a lower-than-normal CO2 production at a given work rate) and, as discussed later, in those having significantly compromised exercise tolerance.
Complicating issues
V′E–V′CO2 slope estimation
From a physiological perspective, it is important that the V′E–V′CO2 slope estimate is constrained to the linear region of the relationship, i.e. not beyond the RCP where respiratory compensation for the metabolic acidosis introduces nonlinearity. Thus, while a V′E–V′CO2 slope estimate obtained from the entire work-rate range (e.g. [40–42]) tends to be favoured for cardiological cohorts because of demonstrably better prognostication (e.g. [43–46]), the departure from V′E–V′CO2 linearity will result in the V′E–V′CO2 slope being over-estimated and the V′E intercept being under-estimated, with implications for ventilatory efficiency judgements [47].
Equality between V′E/V′CO2 min and V′E–V′CO2 slope
This equality reflects V′E/V′CO2 min approximating the V′E–V′CO2 slope at high V′CO2 values (figure 1a and b) [10, 15, 32]. However, when circumstances change, maintained equality depends critically on the behaviour of the V′E intercept. For example, were the V′E–V′CO2 slope to be caused to increase but with no change in the V′E intercept, this would result in predictable increases in V′E/V′CO2 (equation 6) such that the V′E/V′CO2 response profile would be shifted upwards with a new increased V′E/V′CO2 min equal to the new increased V′E–V′CO2 slope (figure 3). In contrast, were the V′E intercept to increase but with no change in the V′E–V′CO2 slope, the V′E/V′CO2-response profile would be shifted upwards with a new increased V′E/V′CO2 min that would exceed the unchanged V′E–V′CO2 slope (figure 4).
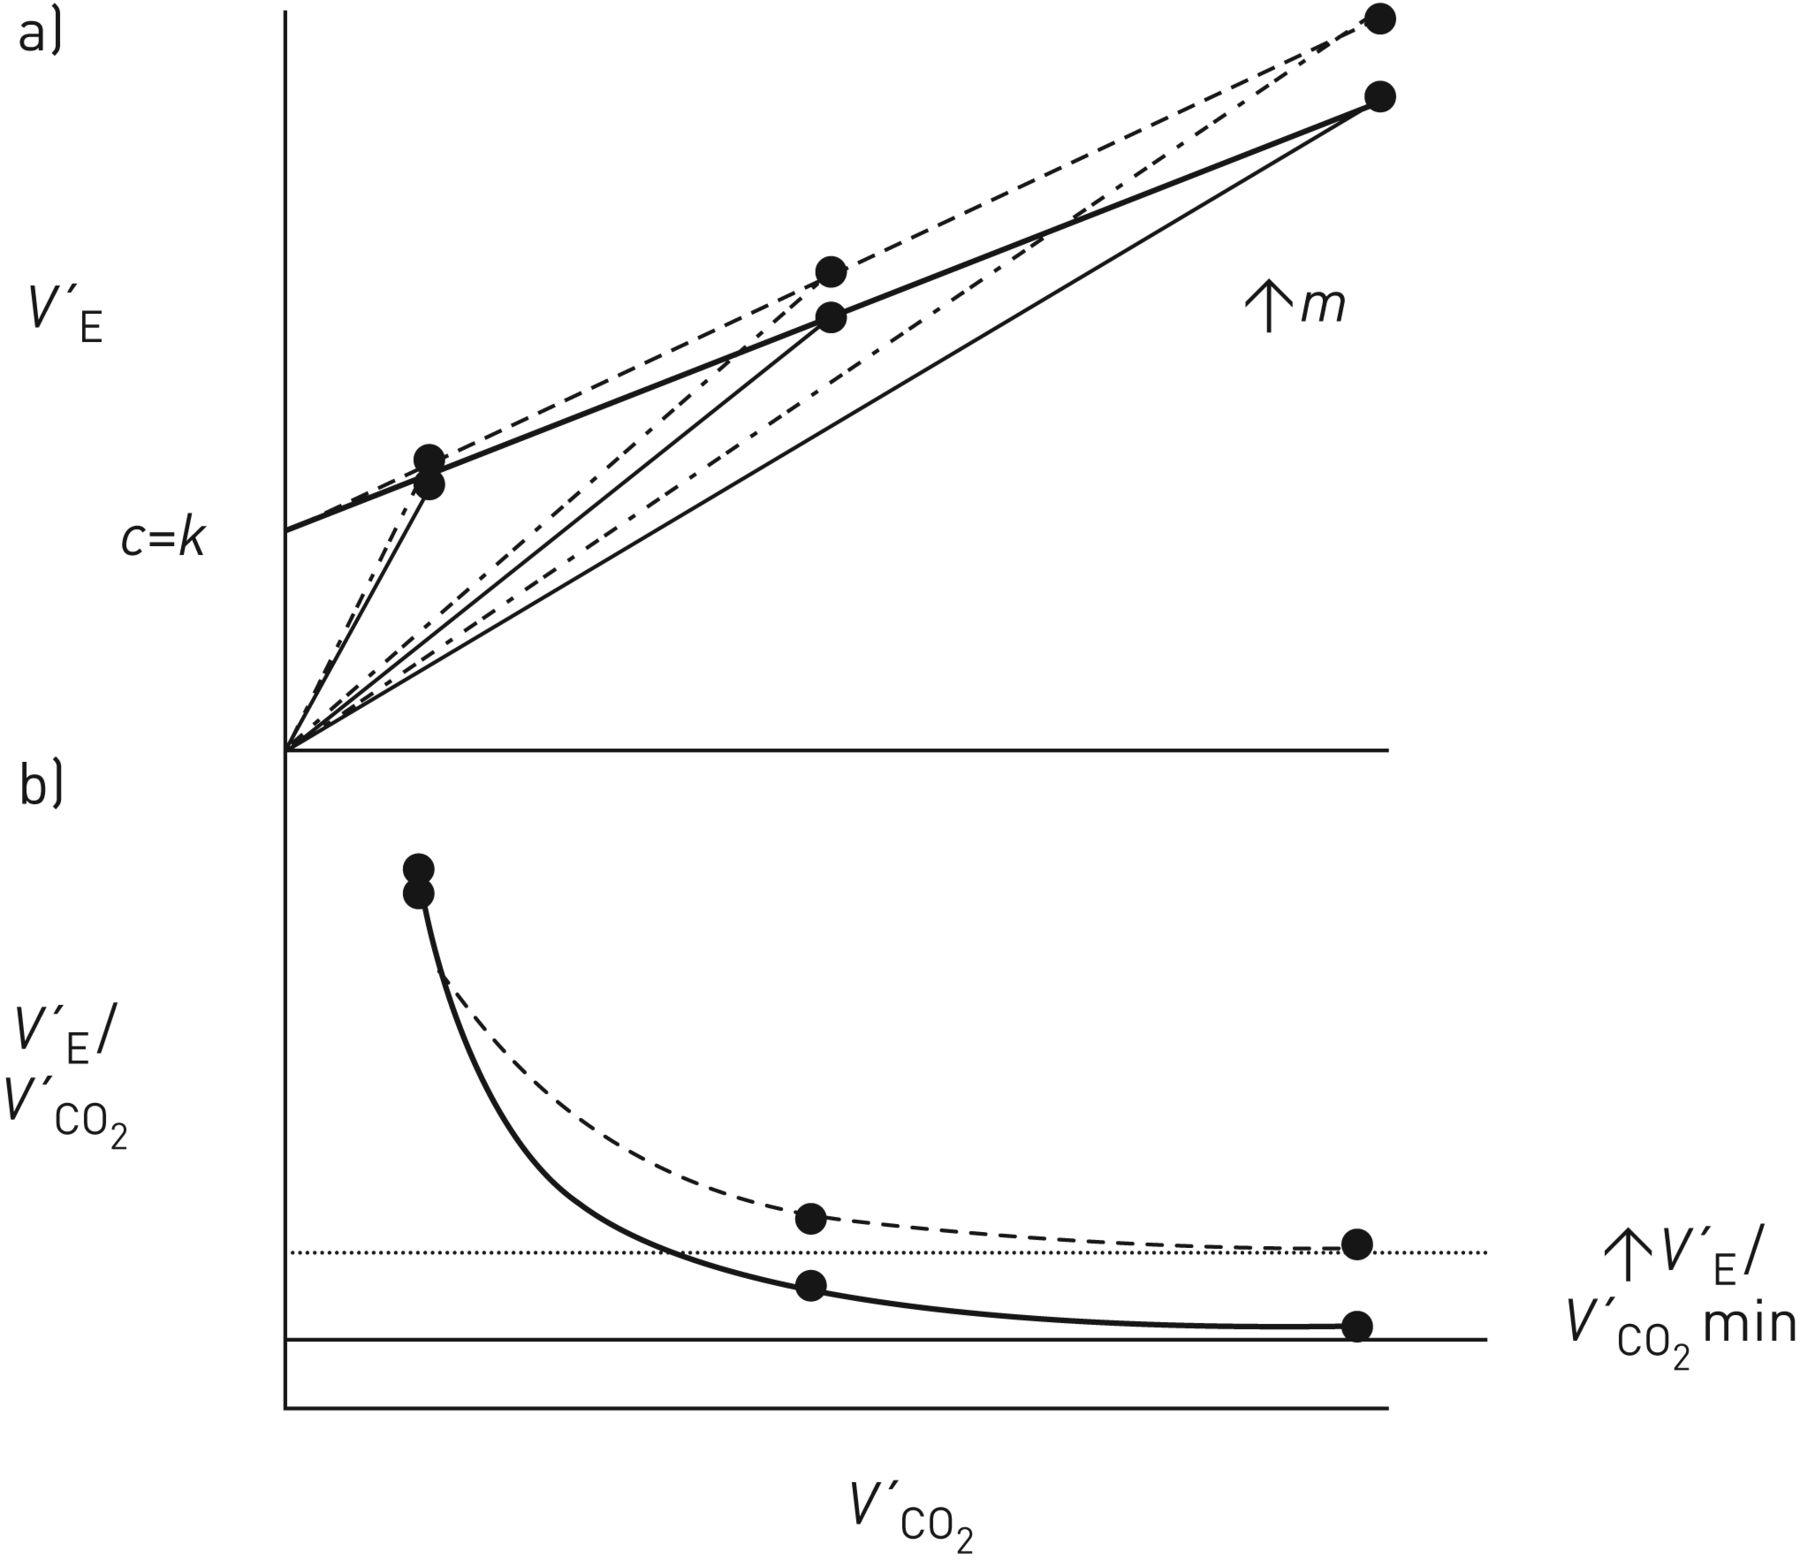
Schematic representation of a) the effects of a hypothetical intervention that increased the V′E–V′CO2 slope (m) with no change in the V′E intercept (c) on ventilation (V′E) and b) ventilatory equivalent for CO2 (V′E/V′CO2) as a function of CO2 output (V′CO2) during rapid-incremental (or ramp) exercise for work rates where arterial CO2 tension (PaCO2) is assumed to be stable. Solid profiles: pre-intervention; dashed profiles, post-intervention.

Schematic representation of a) the effects of a hypothetical intervention that increased the V′E-intercept (c) with no change in the V′E–V′CO2 slope (m) on ventilation (V′E) and b) ventilatory equivalent for CO2 (V′E/V′CO2) as a function of CO2 output (V′CO2) during rapid-incremental or ramp exercise for work rates where arterial CO2 tension (PaCO2) is assumed to be stable. Solid profiles: pre-intervention; dashed profiles, post-ntervention.
However, when exercise tolerance is severely compromised, the normal equality between V′E/V′CO2 min and the V′E–V′CO2 slope may not obtain. Thus, in poorly fit individuals and in significantly limited patients, the RCP may be sufficiently low as to occur on the still-falling V′E/V′CO2 trajectory [18, 48]. In such a situation, as V′E/V′CO2 min will exceed the V′E–V′CO2 slope, the latter would therefore be the only physiologically meaningful index of ventilatory efficiency. This scenario also has implications for RCP estimation. That is, respiratory compensation could be achieved with V′E/V′CO2 still declining, but at a lesser rate than isocapnia would require, i.e. decreasing less than VD/VT [29, 30].
The V′E intercept
The potential value of incorporating the V′E intercept, conjointly with the V′E–V′CO2 slope, into clinical analyses of exercise intolerance in the context of co-morbidities and prognostication is becoming recognised [18, 49–52]. The physiological basis of the V′E intercept can only be conjectured on, however. Simply put, it expresses a notional V′D at a hypothetical V′CO2 of zero, and therefore is unlikely to represent any actual V′D [15, 17] c.f. [51, 53]. In a geometrical sense, the position of the V′E–V′CO2 relationship could be considered to be dictated by the resting V′E, V′CO2 “operator”, such that the V′E intercept is merely a “passive” consequence of the underlying exercise ventilatory control process. Alternatively, the V′E intercept could reflect some mechanistic interplay between VD/VT and PaCO2 in setting the required exercise V′E [10, 54]. This clearly demands resolution.
PaCO2 in rapid-incremental exercise
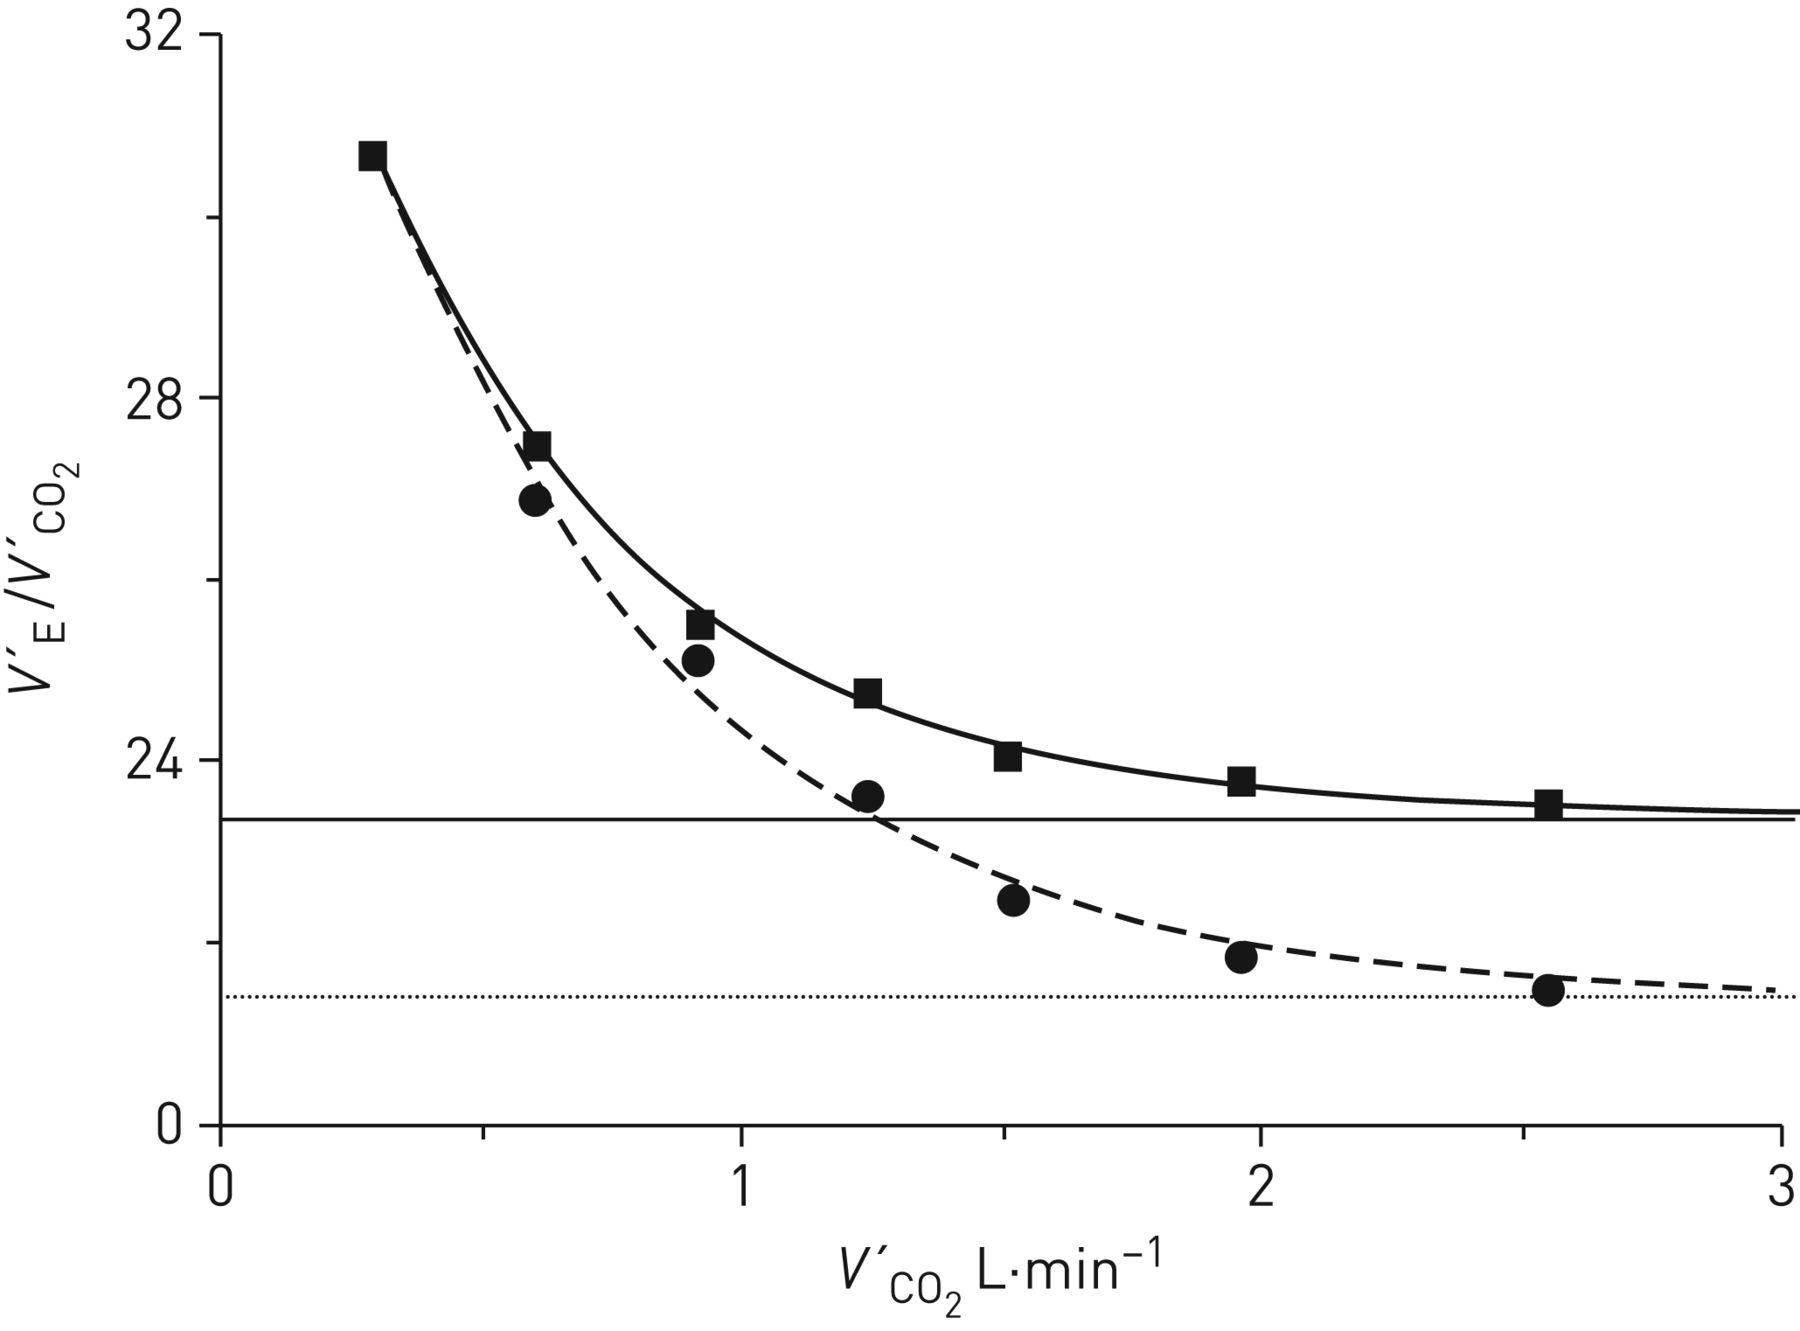
The implicit assumption of a stable PaCO2 over a wide range of work rates, accomplished through the proportional hyperbolic behaviours of V′E/V′CO2 and VD/VT is open to some question for rapid-incremental exercise. That is, while V′E evidences a close dynamic coupling to V′CO2, its slightly longer time constant of response [7–9] predicts a modest but systematic increase in PaCO2 [25, 55, 56]. This predictably impacts on ventilatory efficiency estimates, as illustrated by inserting the group-mean gas-exchange responses for ramp exercise reported by Sun et al. [56] into equation 7, with reasonable assumptions being made for the concomitant VD/VT responses [33–36]. When the measured PaCO2 values (i.e. increasing from 40.8 mmHg at rest to 44.6 mmHg just prior to the RCP) were used, the V′E–V′CO2 slope and V′E intercept were estimated to be 20.0 and 3.92 L·min−1, respectively (figure 5, dashed line). This contrasts with slope and intercept values of 22.4 and 2.70 L·min−1 if PaCO2 were constrained to remain at the resting value of 40.8 mmHg (normocapnia) up to the RCP (figure 5, solid line). Likewise, the normocapnic V′E/V′CO2 response profile was shifted upwards (figure 6, solid curve) relative to the actual V′E/V′CO2 profile (figure 6, dashed curve), with V′E/V′CO2min being 23.5 compared with 21.5. While these differences are numerically modest, this raises the issue of ventilatory inefficiency being underestimated for the standard CPET ramp exercise testing paradigm, if PaCO2 regulation is assumed.

The V′E–V′CO2 relationship for ramp exercise in which arterial CO2 tension (PaCO2) has been demonstrated to increase progressively up to the lactate threshold [25, 56, 57] (dashed line), compared with that obtaining with PaCO2 constrained not to increase (solid line). Note the decreased slope in the former condition. Data taken from [56].
The corresponding V′E/V′CO2 relationships related to figure 5. Note the depressed V′E/V′CO2 profile consequent to the progressive PaCO2 increase (circles, dashed curve), compared with that obtaining with arterial CO2 tension (PaCO2) constrained not to increase (squares, solid curve). As a result, V′E/V′CO2min was decreased in the former condition.
Interestingly, the profile of increasing PaCO2 with ramp exercise only occurs up to  . Beyond
  , PaCO2 stabilises up to the RCP (i.e. isocapnic buffering) [25, 56]. Paraphrasing Whipp and colleagues “Consequently, PaCO2 becomes constant at [
 ] because of a particular ventilatory response; it does not remain constant because of the lack of one” and “isocapnic buffering during rapid-incremental exercise actually reflects a ventilatory response to the metabolic acidosis which levels a systematically-rising phase of PETCO2 [end-tidal CO2 tension] and PaCO2” [25]. While isocapnic buffering does not represent respiratory compensation in the conventional sense (i.e. a V′E response sufficient to elicit a decrease in PaCO2), one could reasonably argue that the lack of a continuing increase PaCO2 in beyond
  (i.e. a lower-than-expected PaCO2) does not rule it out.
Conclusions
What, therefore, does (and does not) a decrease in ventilatory efficiency connote? One is reminded of Moritz Schlick's statement in 1936 that “The meaning of a proposition is the method of its verification” and which he appropriately attributed to Ludwig Wittgenstein [57]. Generically speaking, ventilatory efficiency is simply the V′E “tasked with” clearing metabolically-produced CO2 during exercise, being expressed mathematically as either the V′E–V′CO2 slope or the value of V′E/V′CO2 at  or just prior to the RCP. However, interpretation of ventilatory efficiency should be undertaken with caution, as high values of V′E–V′CO2 slope and V′E/V′CO2min could reflect a low PaCO2, a high VD/VT or both; rigorous discrimination therefore requiring simultaneous PaCO2 monitoring.
A clear distinction should be drawn between ventilatory efficiency and pulmonary CO2 exchange efficiency; the latter being conventionally quantified as (1−VD/VT) [1–3]. Thus, a decrease in (1−VD/VT) reflects a reduction in gas-exchange efficiency, consequent to V′A/Q′ mismatching and/or a right-to-left shunt. In such a situation, if V′E is constrained or limited from increasing, PaCO2 will rise (as with severely impaired respiratory mechanics). However, in individuals with normal pulmonary function, a high VD/VT can simply result from a tachypnoeic pattern of breathing.
In conclusion, if PaCO2 is regulated, a high V′E–V′CO2 slope is a useful but not rigorous index of a high VD/VT, unless account is taken of the V′E intercept as is illustrated in figure 4. In contrast, a high V′E/V′CO2min does provide a rigorous index of a high VD/VT (equation 8). For this reason, V′E/V′CO2 is better viewed as the primary CO2-linked ventilatory control variable than is the V′E–V′CO2 slope [10]. And, of course, ventilatory efficiency is necessarily defined over a constrained work-rate range, and thus does not address “efficiency” at high and potentially limiting work rates.
Acknowledgements
This article is dedicated to my longstanding colleague: the late Brian James Whipp who delivered the Jean-Claude Yernault Lecture on “Determinants of the Ventilatory Response to Exercise in Health and Disease: The “Ventilatory Efficiency” Issue” at the 2010 European Respiratory Society International Congress in Barcelona, and to whom a Symposium “Ventilatory Efficiency during Exercise: A Tribute to Brian J. Whipp” was dedicated at the 2013 European Respiratory Society International Congress in Barcelona.
Footnotes
Previous articles in this series: No. 1: Laveneziana P, Di Paolo M, Palange P. The clinical value of cardiopulmonary exercise testing in the modern era. Eur Respir Rev 2021; 30: 200187. No. 2: Agnostoni P, Sciomer S, Palermo P, et al. Minute ventilation/carbon dioxide production in chronic heart failure. Eur Respir Rev 2021; 30: 200141. No. 3: Watson M, Ionescu MF, Sylvester K, et al. Minute ventilation/carbon dioxide production in patients with dysfunctional breathing. Eur Respir Rev 2021; 30: 200182.
Provenance: Commissioned article, peer reviewed.
Number 4 in the Series “Ventilatory efficiency and its clinical prognostic value in cardiorespiratory disorders” Edited by Pierantonio Laveneziana and Paolo Palange
Conflict of interest: S.A. Ward has nothing to disclose.
- Received May 26, 2020.
- Accepted August 22, 2020.
- Copyright ©ERS 2021.
This article is open access and distributed under the terms of the Creative Commons Attribution Non-Commercial Licence 4.0.
References


