Article Text

Abstract
Non-invasive ventilation (NIV) is recognised as an effective treatment for chronic hypercapnic respiratory failure. Monitoring NIV during sleep may be preferable to daytime assessment. This paper reports the findings of an international consensus group which systematically analysed nocturnal polygraphic or polysomnographic tracings recorded with either volume-cycled or pressure-cycled ventilators. A systematic description of nocturnal respiratory events which occur during NIV is proposed: leaks, obstruction at different levels of the upper airway (glottis and/or pharynx), with or without decrease of respiratory drive and asynchrony.
- Non invasive ventilation
- ventilators
- sleep apnoea, obstructive
- sleep apnoea, central
- polysomnography, monitoring, sleep
- assisted ventilation
- non invasive ventilation
- sleep apnoea
Statistics from Altmetric.com
- Non invasive ventilation
- ventilators
- sleep apnoea, obstructive
- sleep apnoea, central
- polysomnography, monitoring, sleep
- assisted ventilation
- non invasive ventilation
- sleep apnoea
Introduction
Non-invasive ventilation (NIV) is recognised as an effective treatment for chronic hypercapnic respiratory failure. In many centres, when NIV is implemented, ventilatory parameters are chosen empirically taking into account the underlying disease, patient tolerance while awake and changes induced in diurnal arterial blood gas.1 However, NIV is predominantly applied at night when profound changes in ventilatory patterns, respiratory drive and respiratory muscle recruitment may occur, particularly in patients with respiratory failure. These changes also include modifications of upper airway patency.
In addition, NIV itself may induce undesirable respiratory events. Positive pressure ventilation-induced hyperventilation has been shown to promote active glottic closures in normal subjects when awake or asleep.2 3 Basic changes in ventilator settings such as favouring a ‘spontaneous’ versus a ‘controlled’ mode, have been associated with a high rate of central apnoeas in normal subjects.4 NIV is also associated with unintentional leaks. Leaks have been shown to alter not only the efficacy of ventilation5 but also the quality of sleep.6 Significant unintentional leaks have been reported in up to 34% of stable patients under NIV undergoing nocturnal studies.7–9
As a result, monitoring NIV during sleep may be preferable to daytime assessment.10 A previous paper in this series by Janssens et al11 addressed the usefulness of simple tools such as oximetry, transcutaneous carbon dioxide tension (Ptcco2) and software devices but, arguably, this monitoring should be accomplished by performing complete polysomnography (PSG) or ventilatory polygraphy (PG) during NIV in some patients. However, appropriate analysis of PG or PSG recordings must take into account the type of ventilator used (volume- or pressure-cycled), ventilator settings (ventilatory mode, triggers) and choice of interface (nasal or full face mask)12 (see paper by Rabec et al13 in this series). Recent observations have shown that standard definitions for nocturnal respiratory events in spontaneous breathing do not lend themselves well to the description of respiratory events occurring during positive pressure ventilation.14 Indeed, one major difference during NIV is the continuous interaction between the ventilator, generating an intermittent positive pressure, and the patient's neural respiratory drive. During NIV the patient is assisted by a ventilator and events can result from the patient, the ventilator or from poor patient-ventilator coordination. Among the small number of studies available focusing on sleep and NIV, very few have tried to relate untoward respiratory events to alterations in sleep structure and/or reductions in oxygen saturation.6 7 14
This report summarises the observations of a multicentre work group (SomnoNIV) which, over a 2-year period, analysed PG and PSG tracings and collected abnormal respiratory events occurring during nocturnal NIV. The aims were (1) to identify clinically relevant respiratory events (ie, inducing changes in nocturnal oxygen saturation measured by pulse oximetry (Spo2), capnography, arousals or microarousals); (2) to describe their occurrence and type on PG or PSG recordings; (3) to suggest plausible hypotheses as to the cause of these events; and (4) to propose a classification and unambiguous definitions which could be referred to by all interested in this field.
Physiological basis of upper airway patency and ventilatory drive during NIV
Upper airway obstruction corresponds to any dynamic reduction in upper airway patency limiting or interrupting air flow from the nose and/or mouth to the trachea. During NIV this can occur at different levels, each location corresponding to a specific pathophysiological mechanism:15
Nasal obstruction.
Pharyngeal collapse: Passive collapse of the upper airway results from the inability of positive pressure ventilation to stabilise the upper airway throughout the respiratory cycle. This event is comparable to what occurs in obstructive sleep apnoea. Upper airway patency decreases at the end of expiration. During inspiration a further reduction in upper airway patency can lead to a complete collapse. Inspiratory efforts increase, reflecting persistent respiratory drive against the obstruction. These efforts continue until a microarousal occurs, re-establishing upper airway muscular tone and patency and thus ending the event. Out-of-phase or paradoxical thoracoabdominal movements are characteristic of these persistent efforts,16 here against collapse of the upper airway.
Glottic closure: Adduction of the vocal cords resulting in progressive closure of the glottis has been described in response to ventilator-induced hyperventilation.2 3 Glottic closure was shown to be proportional to total ventilation and inversely proportional to end-tidal CO2. These events, comparable to central hypopnoea or apnoea occurring without ventilatory support, are characterised by a simultaneous reduction or abolition of inspiratory effort (ie, reduction or abolition of thoracoabdominal movements), most probably reflecting a decrease in ventilatory command. Glottic closure is also possible, with ongoing respiratory efforts, in amyotrophic lateral sclerosis or myotonic dystrophy.
Ventilatory drive: Ventilatory control is physiologically altered during sleep, with a decreased responsiveness to chemical, mechanical and cortical inputs. The arterial carbon dioxide tension (Paco2) apnoeic threshold is unmasked at 1.5–5.8 mm Hg below eupnoeic Paco2.17 If NIV settings lead to hyperventilation, bursts of central apnoeas or hypopnoeas can occur, particularly during transitions between sleep onset and wakefulness. Furthermore, NIV has the potential to induce periodic breathing during sleep. In a recent PSG study 40% of obese patients using NIV showed a high index of periodic breathing, mostly occurring in light sleep and associated with severe nocturnal hypoxaemia.14 The susceptibility to induction of periodic breathing varies considerably among subjects; its occurrence during NIV is thus difficult to predict and needs to be specifically monitored. It is possible that not only hyperventilation but also NIV-induced decreases in Paco2 in subjects who nevertheless remain hypercapnic may generate central apnoeas or hypopnoeas.
The SomnoNIV Group consensus statement
The SomnoNIV Group includes eight chest physicians and two intensive care specialists from eight university or general hospitals in France, Belgium and Switzerland. All physicians involved are experienced in acute and long-term NIV in patients with chronic respiratory failure. Over a 2-year period, nocturnal PG and PSG tracings of patients during NIV were reviewed and thoroughly discussed in group sessions. Definitions of events and classification presented here are the result of a consensus between all participants.
Monitoring equipment
The following parameters were required as a minimal prerequisite for tracing analysis: mask pressure, flow rate in the circuit measured close to the mask, thoracic and abdominal movements (piezoelectric strain gauges, respiratory inductive plethysmograph effort belts), and pulse oximetry (Spo2). Other signals useful for the interpretation of certain events were optional: monitoring of respiratory efforts (diaphragmatic electromyogram (EMG), cervical muscle EMG, oesophageal pressure, pulse transit time, suprasternal notch pressure).
Monitoring Ptcco2 provides information on alveolar ventilation during NIV, especially if oxygen supplementation is required. However, the lag time of transcutaneous capnometers is too long for Ptcco2 tracings to contribute to the analysis of short respiratory events18 19 (see previous paper in the series by Janssens et al).11 Furthermore, assessment of sleep quality and sleep fragmentation (EEG) when possible is of interest.
Polygraphic features under NIV
In all figures provided, tracings are presented in the following order (from top to bottom): pressure, flow, thoracic movements, abdominal movements and Spo2. Pressure and flow were always measured with an external pressure sensor and with an external pneumotachograph.
Normal patterns during appropriate patient-respirator interaction in NIV
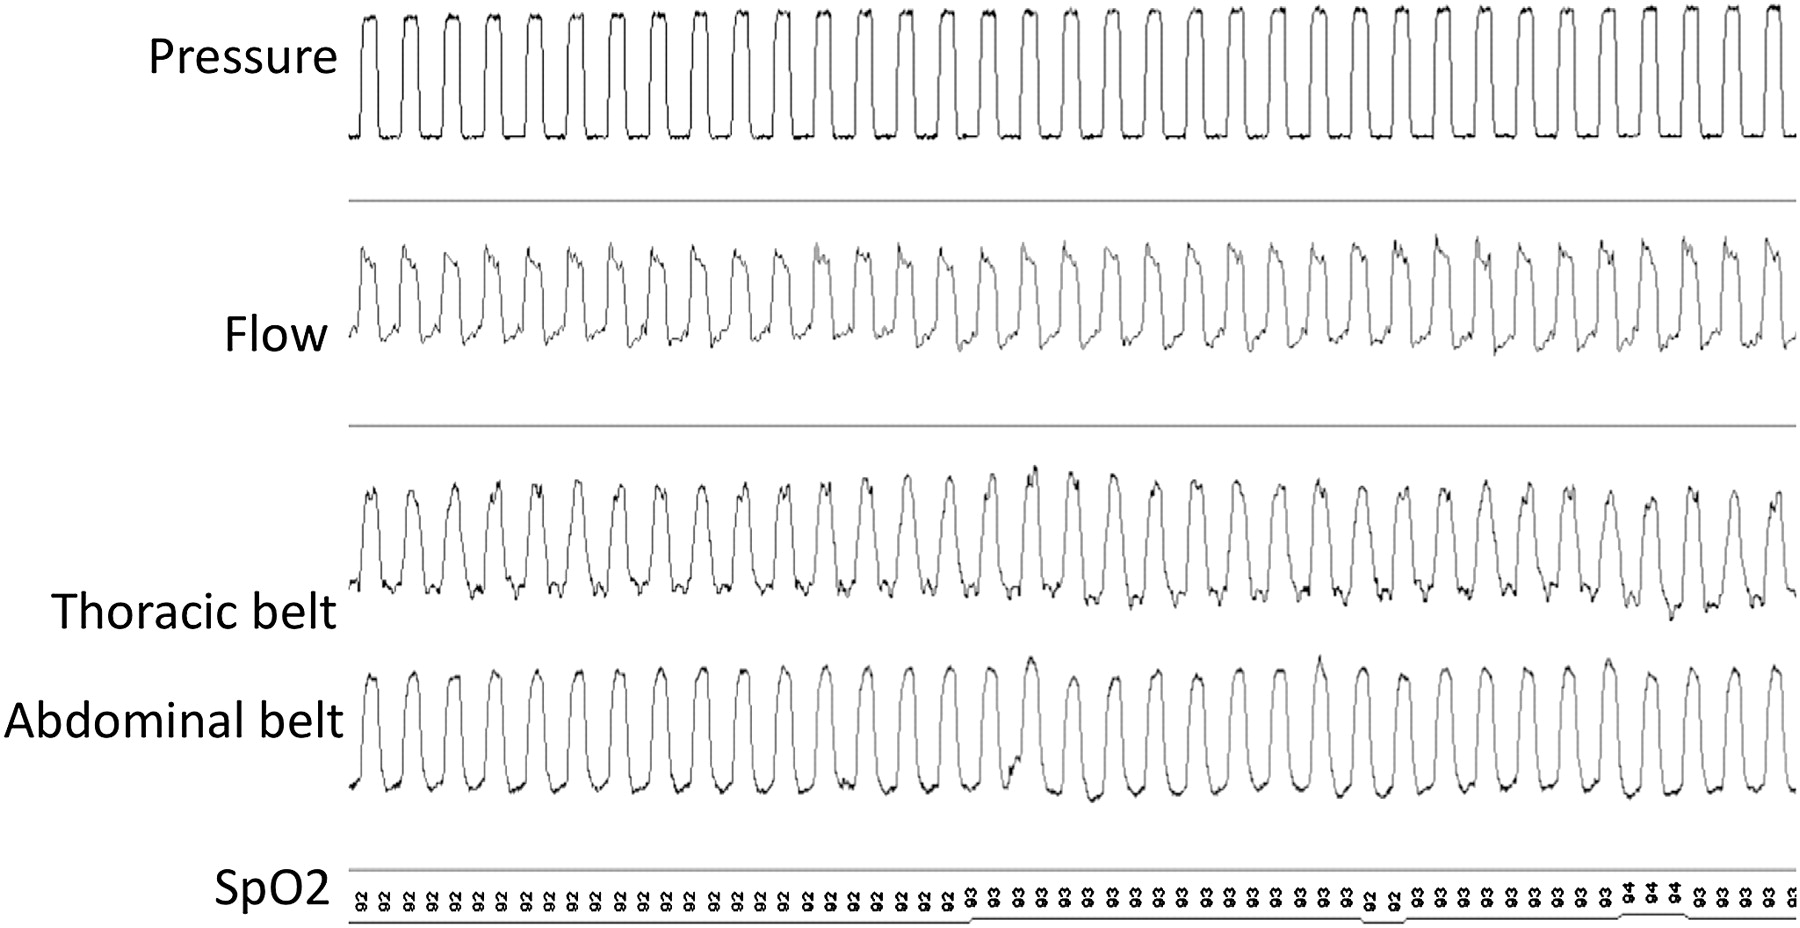
Important items which must be identified are synchronisation between the beginning and end of pressurisation and thoracoabdominal movements and stability of the Spo2 signal. Triggering and cycling occur at the same time as the beginning and end of inspiratory efforts on thoracoabdominal signals. There are no ‘unrewarded’ inspiratory efforts or, conversely, pressurisations without synchronous thoracoabdominal movements (figure 1).

Tracings during pressure-controlled ventilation with a nasal mask during appropriate patient-respirator interaction. Ventilator: pressure-controlled ventilator, single branch tubing, facial mask with leak. Settings: assist-control mode with back-up respiratory rate of 15/min, inspiratory positive airway pressure 20 cm H2O, expiratory positive airway pressure 5 cm H2O, maximum inspiratory time 1.5 s, minimum inspiratory time 0.8 s. Tracing duration 2 min.
Respiratory events
A respiratory event was defined as the occurrence of a modification, discontinuity or instability of ventilation which had deleterious consequences on Spo2, Ptcco2 and/or sleep (ie, arousals or microarousals).
Unintentional leaks
Decrease in pressure signal amplitude
The importance of the leak and the ability of the ventilator to compensate for leaks will determine whether pressure signal amplitude remains stable or decreases. A fall in positive pressure (inspiratory and expiratory) indicates major unintentional leaks (ie, inability of the ventilator to maintain the preset pressure in the ventilator circuit) (figure 2). This sign has a strong positive predictive value but a fall in the pressure signal in some cycles may also indicate a major increase in patient effort (see below and figure 3A).
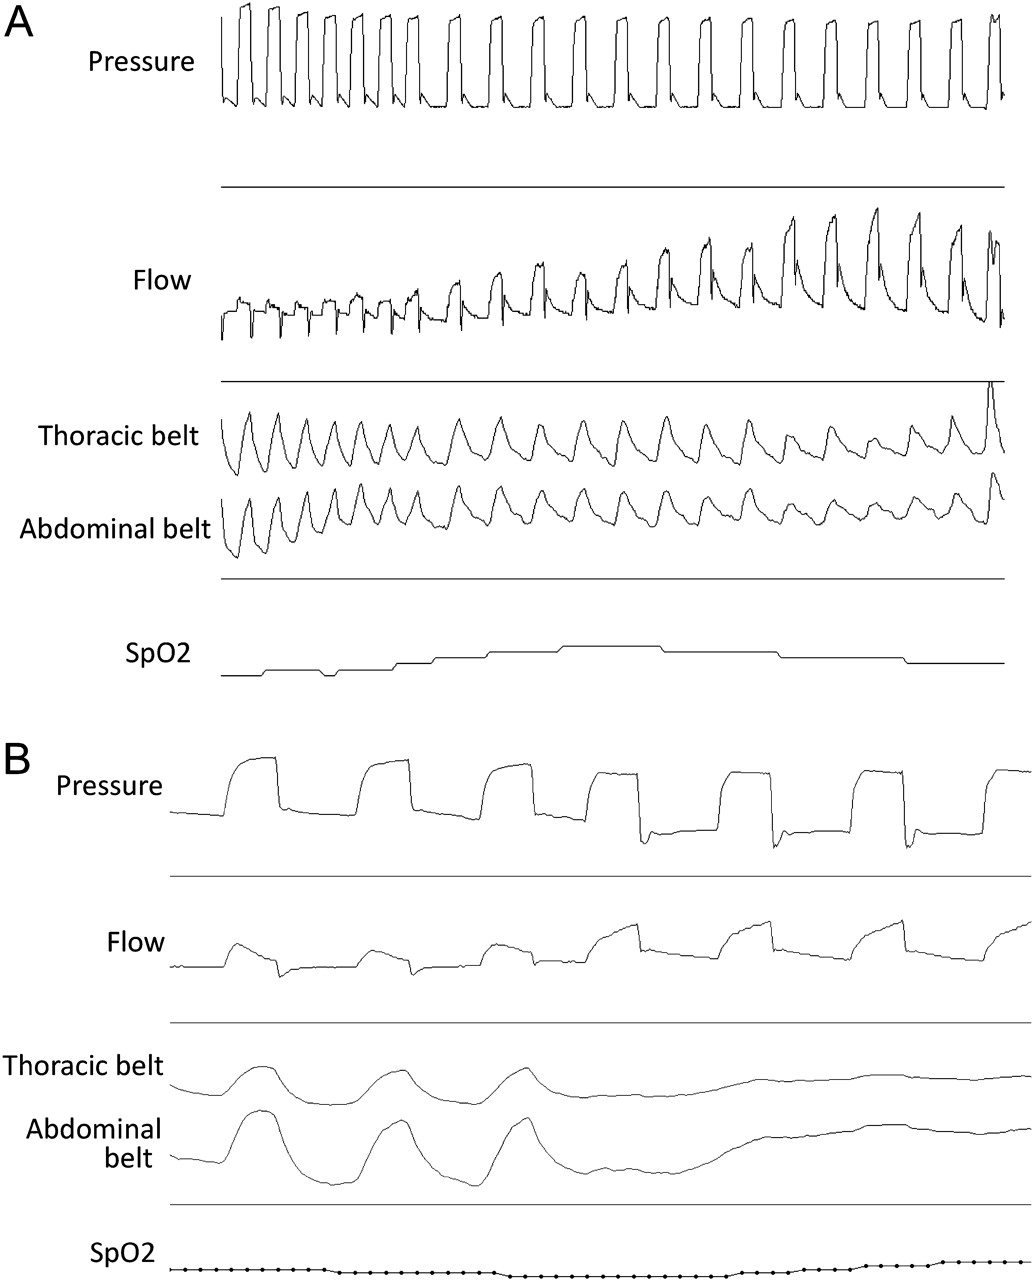
Unintentional leaks with a pressure-controlled ventilator: Typical patterns: (1) expiratory and inspiratory pressures not maintained; (2) increase in machine flow amplitude and reduction in thoracic and abdominal belt signals (A), with possible disappearance of thoracic and abdominal belt signals in the presence of a major leak (B); (3) note the amputation of the expiratory part of the flow curve; (4) an initial rapid increase in inspiratory flow followed by a slower increase in flow until cycling, suggesting a leak. Ventilator: pressure-controlled ventilator, double branch tubing with expiratory valve. Settings: assist-control mode, inspiratory positive airway pressure 22 cm H2O, expiratory positive airway pressure 3 cm H2O, back-up respiratory rate 14/min, inspiratory/expiratory time ratio 1/2. Tracing duration 30 s.
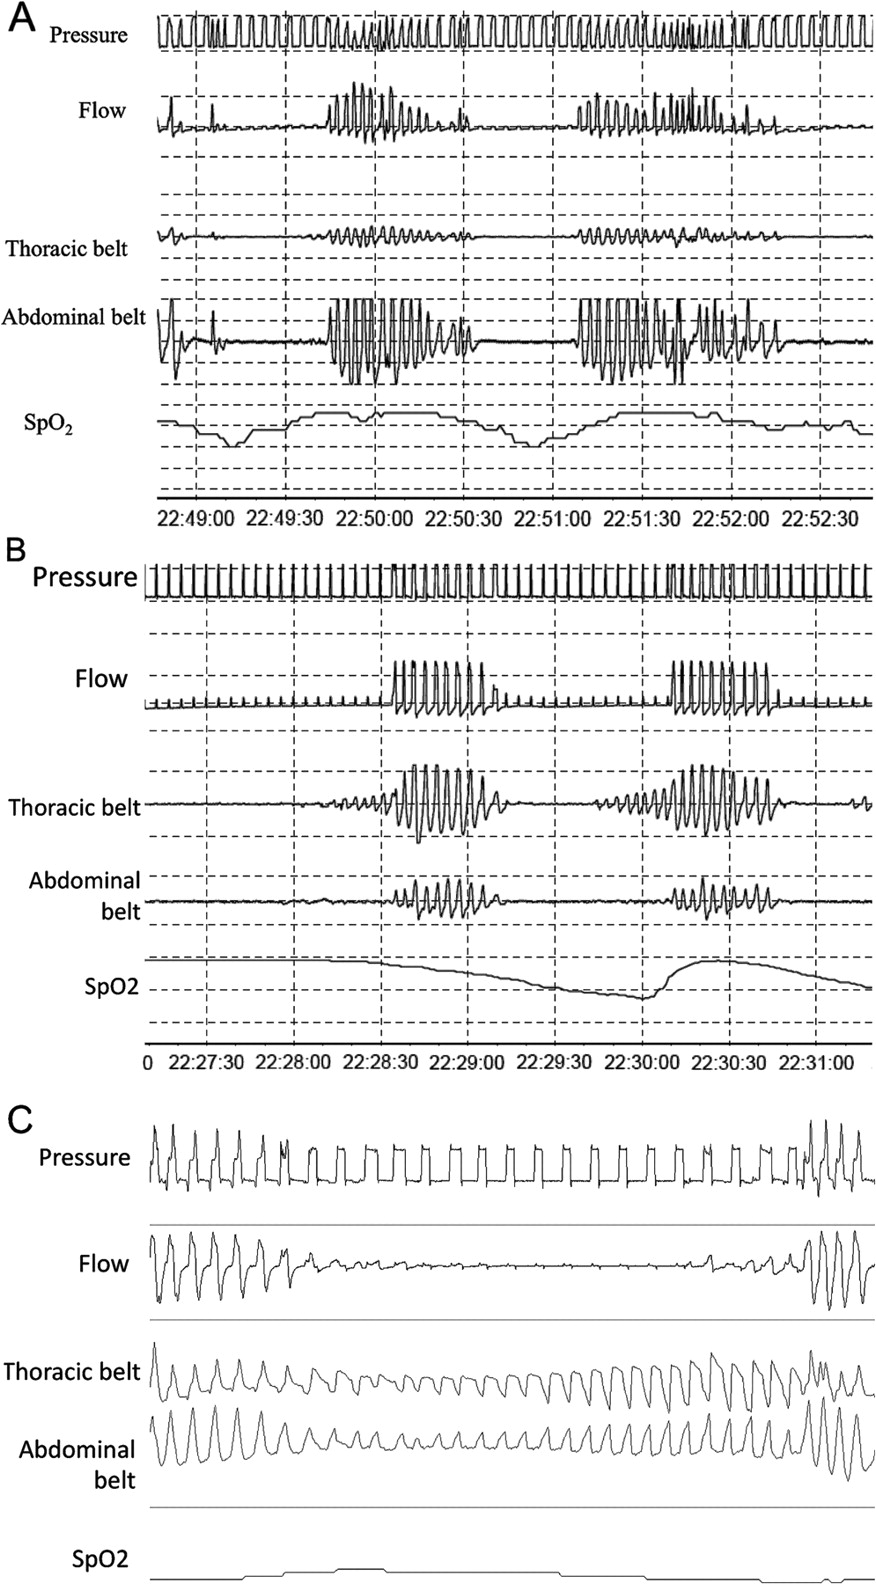
Upper airway obstruction. (A) With decrease in ventilatory command: switch to back-up respiratory rate without thoracoabdominal movements indicating recurrent airway closure with reduced ventilatory command: (1) progressive decrease in flow; (2) pressure signal unchanged; (3) disappearance of thoracoabdominal movements and change to back-up ventilation; (4) entirely synchronous resumption of flow and thoracoabdominal movements without fighting movements. Note: When ventilatory command reappears, pressure may decrease due to patient effort. Ventilator: pressure-controlled, single branch tubing, nasal mask with leak. Settings: assist-control mode with back-up respiratory rate of 14/min, inspiratory positive airway pressure 18 cm H2O, expiratory positive airway pressure 4 cm H2O. Tracing duration 4 min. (B) Mixed event: upper airway obstruction with reduction of ventilatory drive + passive closure of the upper airways and resumption of respiratory drive: (1) disappearance of flow and thoracic and abdominal belt signal; (2) change to back-up rate during phase of flow reduction; (3) resumption of thoracoabdominal movements before normal flow is re-established (suggesting upper airway obstruction occurring after resumption of ventilatory command). Ventilator: pressure-controlled, single branch tubing, nasal mask with intentional leak. Settings: assist-control mode with back-up respiratory rate of 14/min, inspiratory positive airway pressure 18 cm H2O, expiratory positive airway pressure 4 cm H2O. Tracing duration 4 min. (C) Without reduction of ventilatory drive: (1) sudden reduction in flow amplitude; (2) phase opposition or phase angle in thoracic and abdominal belts; (3) increase in respiratory rate at the end of the event due to increase in patient efforts to open the airways; (4) patient-ventilator asynchrony. Ventilator: pressure-controlled, double branch tubing, nasal mask. Settings: assist-control mode with back-up respiratory rate of 14/min, inspiratory positive airway pressure 12 cm H2O, expiratory positive airway pressure 5 cm H2O, maximum inspiratory time 1.7 s, minimum inspiratory time 1.2 s.
Changes in inspiratory flow curve (with pressure-controlled ventilation)
The inspiratory flow curve—in the absence of leaks—shows a very rapid increase in flow, reaching an early peak (when predetermined inspiratory pressure is reached) followed by a progressive decrease until cycling (figures 1 and 2). In case of leaks, the inspiratory flow curve shows a characteristic two-slope aspect, with an initial rapid increase followed by a slower increase in flow until cycling occurs (figure 2). An increase in inspiratory time may also happen in the case of flow cycling (figure 2B). This aspect most probably results from a progressive acceleration of the ventilator turbine to compensate for leaks.
Decrease in abdominal and thoracic belt signals
With pressure-controlled ventilators, an increase in ventilator flow signal during insufflation with a simultaneous decrease in thoracic and abdominal belt signal amplitude is suggestive of unintentional leaks (figure 2A). Ventilator flow increases to compensate for drop in pressure, but leaks result in decreased effective tidal volume.
An increase in flow amplitude during insufflation can also be seen in case of increased inspiratory efforts of the patient occurring simultaneously to inspiratory pressurisation. In that case, the increase in insufflation flow amplitude is associated with an increase in thoracic and abdominal belt signal amplitudes (figure 4).

Increase in flow amplitude during insufflation without unintentional leaks with a pressure-controlled ventilator: simultaneous increase in signal from the thoracic and abdominal belts suggesting inspiratory efforts and increase in inspiratory flow, with no change in pressure. Ventilator: pressure-controlled ventilator, single branch tubing, facial mask with leak. Settings: assist-control mode with back-up respiratory rate of 14/min, inspiratory positive airway pressure 18 cm H2O, expiratory positive airway pressure 6 cm H2O, maximum inspiratory time 2.0 s, minimum inspiratory time 1.2 s. Tracing duration 30 s.
Because of the inability of volume-controlled ventilators to compensate for leaks, a decrease in thoracic and abdominal belt signal amplitude can occur even in the presence of small leaks without any increase in flow signal. However, a decrease in pressure signal is usual (figure 5).

Unintentional leaks with a volume-controlled ventilator: (1) inspiratory pressure is not maintained; (2) inspiratory flow amplitude is maintained with reduction in thoracic and abdominal belt signals; (3) note the amputation of the expiratory part of the flow curve; (4) asynchrony patient/ventilator at the end of the leaks. Ventilator: volume-controlled ventilator, double branch tubing with expiratory valve. Settings: assist-control mode, tidal volume 700 ml, expiratory positive airway pressure 0 cm H2O, back-up respiratory rate 12/min, inspiratory/expiratory time ratio 1/2. Tracing duration: 2 min. Oxygen saturation by pulse oximetry (Spo2) is missing.
With any ventilation mode, disappearance of thoracic and abdominal belt signals can also be observed in case of major unintentional leaks (figure 2B).
Amputation of expiratory flow signal
If present on baseline tracing (pneumotachograph between mask and expiratory valve), an amputation of the expiratory part of the flow curve indicates the loss of expiratory flow in the circuit and thus leaks (figure 2A and figure 5).
Patient-ventilator asynchrony and switch of ventilator to back-up respiratory frequency
Leaks favour the non-detection of the patient's inspiratory efforts by the ventilator and a switch to back-up respiratory frequency in assist-controlled mode (figure 5). The appearance of the flow and pressure curves may change significantly according to the ventilator used and its cycling mechanism (see paper in the series by Rabec et al13). This may result in patient-ventilator asynchrony (figure 5).
Decrease in ventilatory drive
On a simple PG without measurement of either oesophageal pressure, respiratory muscle EMG or any other indirect signal of inspiratory effort (such as pulse transit time20), the essential feature of a decrease in ventilatory command is a proportional and simultaneous reduction in flow and in thoracic and abdominal belt signal amplitudes. A decrease in flow and in thoracic and abdominal belt signal amplitudes occurs without phase opposition (figure 6A). In the absence of a back-up respiratory rate (ventilator in ‘spontaneous’ mode), thoracic and abdominal belt signals may disappear completely (figure 6B), generating a pattern of recurrent central apnoeas. With a back-up respiratory rate, the length of the events is limited by the preset maximal interval between breaths (figure 6A).

Decrease in ventilatory drive. (A) With back-up ventilation: reduction in abdominal and thoracic belt signal amplitudes without phase opposition and with change to back-up ventilation. Ventilator: pressure-controlled, single branch tubing, nasal mask with leak. Settings: assist-control mode with back-up respiratory rate 14/min, inspiratory positive airway pressure 13 cm H2O, expiratory positive airway pressure 5 cm H2O, maximum inspiratory time 1.7 s, minimum inspiratory time 1.3 s. Tracing duration 3 min. (B) In the absence of back-up ventilation: disappearance of pressure signal, flow signal and thoracic and abdominal belt signals. Ventilator: pressure-controlled, single branch tubing, nasal mask with leak. Settings: assist mode, inspiratory positive airway pressure 12 cm H2O, expiratory positive airway pressure 3 cm H2O. Tracing duration 3 min.
Partial or total upper airway obstruction with reduction of ventilatory drive
A few simple signs can be suggestive of airway closure with reduced ventilatory command:
Progressive and smooth reduction in flow amplitude while amplitude of pressure signal is unchanged (figure 3A,B).
Simultaneous reduction or disappearance of thoracic and abdominal belt signal.
Switch of ventilator to back-up respiratory rate (assist-control mode) without thoracic or abdominal movements (figure 3A).
Patient-ventilator asynchrony because the ventilator may not detect the patient's inspiratory efforts during upper airway closure, the abovementioned change to back-up respiratory rate may be associated with patient-ventilator asynchrony.
Mixed events: partial or total closure of the upper airways and reduced ventilatory drive followed by passive closure of the upper airways and resumption of respiratory drive
A synchronous reduction in flow, thoracic and abdominal movements and respiratory rate with resumption of thoracic and abdominal movements before restoration of normal flow suggests initial obstruction of the upper airway with reduced ventilatory command followed by persistent obstruction of the upper airways in spite of resumption of ventilatory command (figure 3B).
Partial or total upper airway obstruction without reduction of ventilatory drive
Sudden reduction in flow amplitude with different evolutions of the pressure signal
With a pressure-controlled ventilator, a sudden reduction in flow amplitude during insufflation while inspiratory positive pressure is maintained suggests upper airway obstruction or instability (figure 3C). With a volume-controlled ventilator, a sudden reduction in flow amplitude with an increase in insufflation pressure until maximal preset peak pressure is reached also suggests upper airway obstruction or instability. In this case an inversion of the pressure curve can be seen with an initial peak pressure followed by a decrease of pressure related to mouth leak.
Phase opposition or phase angle in thoracic and abdominal belts
A phase opposition or a phase angle with a negative inflexion of the thoracic belt signal on inspiration associated with a positive inflexion of the abdominal belt signal suggests fighting,16 here against upper airway obstruction (figures 3C and 7). Note that the phase opposition can be seen with a positive inflexion of the thoracic belt signal and a negative inflexion of the abdominal belt signal in the case of diaphragmatic weakness and use of accessory muscles. A large increase in abdominal and thoracic belt signals, with an increase in respiratory rate of the patient due to increasing efforts to open the airways also suggests upper airway obstruction (figures 3C and 7).

Upper airway obstruction in a volume-controlled mode: (1) sudden reduction in flow amplitude; (2) increase in insufflation pressure; (3) phase opposition in thoracic and abdominal belts; (4) patient-ventilator asynchrony. Ventilator: volume-controlled, double branch tubing, facial mask. Settings: assist-control mode, tidal volume 600 ml, respiratory rate 16/min, inspiratory/expiratory time ratio 1/2, maximal peak pressure 50 cm H2O. Tracing duration 2 min.
Patient-ventilator asynchrony and switch to back-up respiratory rate
As mentioned above, upper airway obstruction is associated with poor detection of the patient's inspiratory efforts; thus a switch to back-up respiratory rate in assist-controlled mode can be observed. In this situation, the appearance of the flow and pressure curves may change significantly according to the ventilator used and its cycling mechanism (see paper by Rabec et al13 in this series). The shape and duration of insufflation can either increase or dramatically decrease (figure 3B). This can result in patient-ventilator asynchrony (figures 3C and 7).
Discussion
This paper reports the findings of an international consensus group which systematically analysed nocturnal PG and PSG tracings recorded with either volume-cycled or pressure-cycled ventilators. Over a period of 2 years this group has identified respiratory events occurring specifically under NIV, described the PG semiology of these events and proposed pathophysiological mechanisms underlying the occurrence of such events.
Our main findings are that: (1) nocturnal respiratory events occur during NIV: leaks, obstructions at different levels of the upper airway (glottis and/or pharynx), with or without a decrease in respiratory drive and asynchrony; (2) the nomenclature defining abnormal nocturnal respiratory events during sleep in spontaneous breathing is not applicable for describing PG or PSG under NIV and a new specific terminology is proposed9; and (3) these events may lead to drops in Spo2 and/or sleep disruption and are certainly clinically relevant even if their impact on outcome measures such as morbidity and survival has yet to be established.
Technical considerations
The work group identified a certain number of pitfalls adding to the complexity of a systematic analysis of PG or PSG during NIV. Among these pitfalls are the major differences between ventilators in terms of leak compensation. This is particularly true between volume-cycled and pressure-cycled ventilators. The semiology of leaks is therefore completely different depending on the technology used. Pressure and flow curves also differ markedly among the different ventilators available for home care.21 Recording analysis must take into account differences in available settings for triggering or cycling,21 or new modes of ventilation such as volume-targeted pressure support,22 23 autotitrating pressure support24 or proportional assist ventilation.
Our work group considers as a minimal prerequisite for PG analysis the presence of signals for pressure, flow, abdominal and thoracic movements and Spo2. These tools are generally sufficient to identify, with an adequate specificity, events such as leaks, periodic breathing, typical obstructive events and their consequences. It is possible that events such as leaks are underscored by PG or PSG. Future research should aim to validate quantification of leaks by ventilator software (see previous paper in this series by Janssens et al11) and confront ventilator signals and PG /PSG analysis. Reduction of ventilatory drive and subtle increases in inspiratory effort related, for instance, to increased upper airway resistance are more difficult to document using only these tools and may also be underestimated. This underlines the importance of having reliable quantitative measurements of respiratory effort. Oesophageal pressure is the reference signal validated both in the ICU for improving the setting of the ventilators and in the field of sleep medicine.25 However, in clinical routine its acceptability is questionable because of associated sleep fragmentation and leaks around the mask induced by the oesophagal probe. Non-invasive alternatives for respiratory effort assessment are necessary. Diaphragmatic or cervical muscle EMG, suprasternal notch pressure or pulse-transit time, which are used during sleep studies in spontaneous breathing as indirect indicators of inspiratory effort, are promising candidates.20 Further studies should aim to determine the sensitivity and specificity of these additional tools for accurately identifying residual respiratory events under NIV.
Events occurring during NIV
The frequency of occurrence of the abovementioned abnormal respiratory events found in stable patients under long-term NIV is still largely undetermined and may depend on the underlying disease. To our knowledge, only two studies have analysed and quantified specific nocturnal respiratory events related to NIV. In a small group of patients with stable obesity-hypoventilation,14 although asymptomatic (ie, not complaining of sleep disruption or ventilator-related nocturnal discomfort), a high proportion of subjects had prolonged periods of patient-ventilator asynchrony (55%) and 40% had recurrent events which would qualify as ‘recurrent decreases or suppression of ventilatory command’. Fanfulla et al26 found, in a heterogeneous population of 48 patients on long-term home NIV, that more than half of these patients had patient-ventilator asynchrony. Apparently this did not influence compliance with NIV and the patients did not report perception of arousals. In this study there was a correlation between the index of asynchrony and the severity of nocturnal desaturation. These desaturations may potentially be associated with long-term cardiovascular consequences and neuropsychological alterations. A recent randomised controlled study comparing volume-targeted bi-level pressure support versus conventional bi-level pressure support showed a significant difference in the perception of sleep and microarousals between the two techniques, suggesting that repeated changes in pressure related to volume targeting may themselves generate untoward respiratory events despite improving alveolar ventilation.22 In this last study, contrary to the study by Fanfulla et al,26 agreement between subjective perception of quality of sleep and sleep disruption on PSG suggests that the impact of NIV on quality of sleep may be important for compliance and patient motivation. Some teams have suggested that the use of high pressure is required for improving long-term evolution of ventilated patients with chronic obstructive pulmonary disease,27 but the effects of such settings on sleep and residual events is so far unknown and could be deleterious.
Two authors emphasised the importance of leaks in long-term NIV and their negative impact on sleep structure, as well as the improvement in quality of sleep after correction of leaks.6 9 28 When mouth leaks were abolished, both sleep and efficacy of ventilation improved. Teschler et al6 reported that large leaks could occur without obvious opening of the mouth as air escaped through a corner of the apparently closed mouth.
Relevance of detailed analysis of respiratory events occurring under NIV
An understanding of how NIV ‘works’ is critical in determining the therapeutic end point of NIV and its monitoring, but this remains unresolved.29 Competing theories include resting of chronically fatigued respiratory muscles, increasing the compliance of the respiratory system through increased tidal volumes, reducing the load against which the respiratory muscle pump must work, resetting of respiratory centres at a more physiological value of Paco2, improving quality of sleep and avoiding cardiovascular consequences of repeated or prolonged nocturnal desaturations. We can therefore only speculate that identifying, quantifying and trying to correct nocturnal events which affect quality of sleep,6 increase work of breathing,22 alter central respiratory drive2 3 or induce oxygen desaturations are clinically relevant. One can postulate that improving quality of sleep through a better adjustment of NIV is itself clinically relevant in improving quality of life. However, the impact of this approach on compliance, morbidity and survival remains undetermined and speculative. It is also unclear at this time whether fully ventilated patients without any effort during the night have a positive impact on their evolution. Our standardised way of analysing quality of ventilation and related efforts might lead to a better understanding of this topic.
In conclusion, the list of events identified by our work group creates a common framework which allows standardisation of reports and comparison of future studies in this field. Further studies are now needed to replicate this standardised scoring in different centres, to document other as yet unreported events, to establish the prevalence of these problems according to patient diagnosis and type of equipment type and finally to correlate the acute events with chronic outcomes. Once identified, it is necessary to determine how best to deal with these events and to determine their relevance as to major end points such as compliance and morbidity compared with simple monitoring such as overnight oximetry and Ptcco2. Clearly, performing more complex PG and PSG will have cost implications and will affect sleep laboratory workloads. This analysis should provide a useful basis for investigating the role of more detailed monitoring strategies in patients on home ventilation.
Acknowledgments
The authors thank ADEP Assistance for the organisation of the meetings of the SomnoNIV Group.
References
Footnotes
Competing interests None.
Provenance and peer review Commissioned; externally peer reviewed.