Article Text

Abstract
Background Systemic sclerosis (SSc) is an autoimmune disease characterised by fibrosis of the skin and the internal organs. Except for anticentromere, antitopoisomerase I and antipolymerase III antibodies, there are no reliable circulating markers predicting susceptibility and internal organ complications. This study has exploited a proteome-wide profiling method with the aim to identify new markers to identify SSc phenotype.
Method 40 SSc patients were included for proteomic identification. Patients were stratified as having diffuse cutaneous SSc (dcSSc) (n=19) or limited cutaneous SSc (lcSSc) (n=21) according to the extent of skin involvement. As controls 19 healthy donors were included. Blood was drawn and plasma was stored before analysing with the SELDI-TOF-MS. For replication in serum, the cohort was extended with 60 SSc patients.
Results Proteomic analysis revealed a list of 25 masspeaks that were differentially expressed between SSc patients and healthy controls. One of the peaks was suggestive for S100A8, a masspeak we previously found in supernatant of plasmacytoid dendritic cells from SSc patients. Increased expression of S100A8/A9 in SSc patients was confirmed in replication cohort compared with controls. Intriguingly, S100A8/A9 was highest in patients with limited cutaneous SSc having lung fibrosis.
Conclusions S100A8/A9 was robustly found to be elevated in the circulation of SSc patients, suggesting its use as a biomarker for SSc lung disease and the need to further explore the role of TLR in SSc.
- systemic sclerosis
- proteomics
- Toll-like receptors
- s100A proteins
Statistics from Altmetric.com
Introduction
Systemic sclerosis (SSc) is a complex autoimmune disease characterised by extensive fibrosis of the skin and the internal organs, leading to severe debilitation and premature death. Usually, SSc clinical phenotype are subdivided into limited cutaneous SSc (lcSSc) and diffuse cutaneous SSc (dcSSc).1 Currently, there is no effective therapy that halts the progression of fibrosis. In addition, the development of effective therapies is severely hampered due to a lack of knowledge on the disease pathogenesis and/or absence of biomarkers that identify those patients at risk for complications.
Over the past decade, techniques to identify biomarkers for early recognition of disease, prognosis and/or therapy responses have dramatically improved. To our knowledge, hitherto these techniques were not widely applied to patients with SSc. One potential technique to find biomarkers is to measure the circulation proteome. The proteome represents the net result of interactions between genetic background and environmental factors and may be considered as the signature of the disease, hereby circumventing the limitations of RNA transcriptional profiling. Past studies were not able to identify a single protein capable of discriminating between controls and patients, illustrating the complex protein network responsible for a disease phenotype.2 By harnessing the surface-enhanced laser desorption ionisation time-of-flight mass spectrometer (SELDI-TOF-MS), we aimed for the identification of proteins differentially expressed between SSc patients and their healthy counterparts. In addition, we aimed to identify proteins able to distinguish clinical SSc phenotypes.
Methods
Patient inclusion
Blood samples were prospectively collected from 21 lSSc patients, 19 dSSc patients and 19 healthy controls for proteomics, and 60 additional samples were used for replication. The local ethics committee from the RUNMC approved the study protocol. Venous blood was collected in a 10 mL lithium-heparin Vacutainer (BD). The samples rested for 10 min at room temperature and were then centrifuged at 3000 rpm for 10 min. All samples were aliquoted and immediately frozen at −80°C until further use. Patient’s characteristics are summarised in table 1. All patients fulfilled the American College of Rheumatology criteria for SSc.3 Patients were subdivided into limited or diffuse SSc on the basis of the extent of skin involvement as described by LeRoy et al.1 Pulmonary arterial hypertension was defined as mean pulmonary artery pressure above 25 mm Hg confirmed by right heart catheterisation in the presence of a normal wedge pressure. Interstitial lung disease was defined as significant bilateral fibrosis on high-resolution CT scan following Wells criteria.4
Patient characteristics of all included patients
SELDI-TOF-MS
Plasma samples were fractionated before protein profiling with a strong anion exchange Q ceramic resin (Bio-Rad Labs, Hercules, California, USA) according to manufacturers’ protocol,5 which resulted in six fractions. The SELDI-TOF-MS technology (Ciphergen Biosystems, Fremont, USA) consists of the protein chip array, mass spectrometer and data analysis software. The analyses were performed at a Ciphergen ProteinChip array system using IMAC ProteinChip arrays with copper surface (IMAC-Cu). The metal affinity-binding IMAC-Cu chips were loaded with 50 μL 0.1 M copper sulfate by vigorous shaking for 10 min. Calibration was done with a 7–30 kDa proteins mixture. After baseline subtraction, peak labelling was performed with CiphergenExpress Software (V.3.0) for peaks with a signal-to-noise (S/N) ratio ≥3 in the m/z range from 1.5 to 30 kDa, and then normalised by total ion current.
S100A8/A9 measurement by ELISA
Supernatant from plasmacytoid dendritic cells (pDC) was retrieved from cultures as described previously.6 Concentrations of S100A8 and S100A9 in serum and supernatant were determined by a sandwich ELISA system established as described previously.7 ,8 S100A8 and S100A9 form non-covalently associated complexes in the presence of extracellular calcium concentrations, which are detected by our ELISA system.8 We therefore calibrated our ELISA with the native S100A8/A9 complex, and the data are expressed as ng/mL S100A8/A9. The detection limit is 1–8 ng/mL. For comparison with earlier studies, internal control sera were used as a reference in all ELISA studies.7–9
Statistical analysis for proteomics
Data analysis was performed using the software GenePattern for statistics and hierarchical clustering.10 For comparisons, a t test was used and adjusted p values were calculated using exhaustive permutation, when possible, or 100.000-fold permutation when software limits were reached. Hierarchical clustering was performed based on Pearson correlation coefficients.
Identifying M/Z scores
The program TagIdent was used to suggest candidate proteins corresponding to the M/Z scores (<explanation>) from the heatmaps by performing a query on the molecular weight (±1%) of each protein.11 The scan in UniProtKB/Swiss-Prot was restricted by organism name ‘homo sapiens’, and the use of the keyword ‘secreted’, excluding intracellular proteins.
Gene ontology
Gene ontology was performed on the predicted protein lists using the Functional Annotation tool of the Database for Annotation, Visualization and Integrated Discovery (DAVID) V.6.7. A functional annotation chart was generated based on the terms GOTERM_BP_FAT, GOTERM_CC_FAT, GOTERM_MF_FAT selected within the category of gene ontology, BBID, BIOCARTA, KEGG pathway, REACTOME pathway.selected within the category of pathways, INTERPRO, PANTHER family, PIR superfamily, SMART selected within the category of Protein domains; Bind, Reactome interaction, ucsc tfbs selected within the category of Protein interactions; and run using the following options Threshold: Count 2; EASE 0,1 and Display: Fold Enrichment; Bonferroni.12
Statistical analysis for replication
Plasma S100A9/A9 levels are shown throughout the paper as mean±SEM. Differences were considered significant for p<0.05. Student t test was used based on the normal distribution of the data. All statistical analyses were performed using GraphPad Prism (GraphPad Prism V.4.0 by Graph Pad software, La Jolla, California, USA).
Results
SELDI-TOF-MS analysis reveals 25 candidate proteins that distinguish SSc from healthy controls
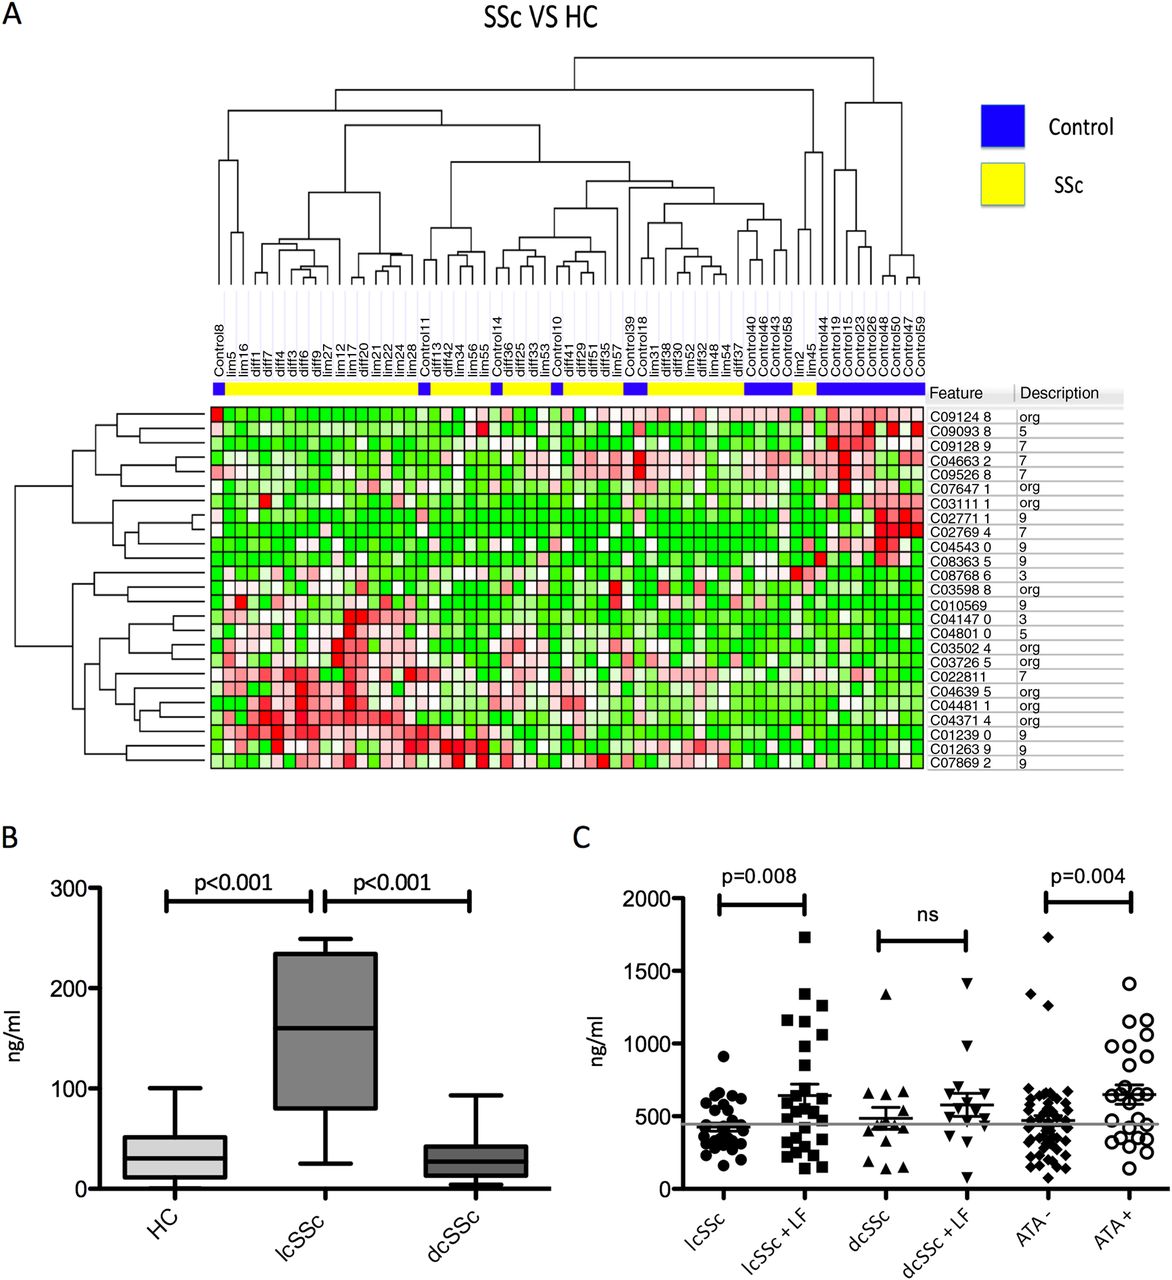
By CART analysis of the 25 mass peaks being the most differentially expressed between healthy controls and SSc patients, we were able to predict SSc accurately in 88% of the SSc patients and predicted 74% of the healthy controls correctly in the overall dataset (table 2, figure 1A). Although we found proteins significantly differentially expressed at mean between lcSSc, dcSSc and healthy controls, these did not reach an optimal threshold >65% in receiver operator curves and were therefore considered not able to predict SSc clinical subtypes consistently (see online supplementary figures S1–S3). Interestingly the masspeak 10866 showed a quite similar pattern to 10569 and was significantly increased in lcSSc compared with HC specifically (AUC=0.76). Both masspeaks are close to the known weight of S100A8.
Differentially expressed protein peaks between healthy controls and SSc patients

(A) Twenty-five protein peaks significantly differentially expressed between 40 systemic sclerosis (SSc) patients and 19 healthy controls (HC). Peaks are clustered based on unsupervised hierarchical clustering by Spearman correlation. (B) S100A8/A9 levels in supernatant from plasmacytoid dendritic cells from 14 HC, 7 limited cutaneous SSc (lcSSc) and 19 diffuse cutaneous SSc (dcSSc) patients were increased in lcSSc compared with HC and dcSSc (p<0.0001). (C) Serum levels of S100A8/A9 from 61 lcSSc patients and 30 dcSSc patients showed an increased level in patients compared with the known upper cut-off of healthy controls (450) and a significant increase of S100A8/A9 in lcSSc with lung fibrosis compared with lcSSc without (p=0.008) and in antitopoisomerase (ATA)-positive patients (p=0.004).
Validation of S100A8/A9 as a biomarker for SSc and its clinical phenotypes
We previously identified a masspeak suggestive for S100A8 in the SELDI-TOF-MS analyses of plasmacytoid dendritic cell (pDC) supernatant, and now we found a peak suggestive for S100A8 in plasma.6 Therefore, we aimed at validation of the potentially increased expression of S100A8/A9 in the supernatant of pDCs from 28 SSc patients and in the circulation of 91 SSc patients by ELISA. In pDC, supernatant from lcSSc S100A8/A9 is specifically increased (145.4±30.5) compared with that of pDCs from dSSc patients (32.2±5.8 (dcSSc); p<0.0001) and their healthy counterparts (35.4±8.7; p=0.0003) (figure 1B). S100A8/A9 was markedly higher in serum of SSc patients (530±32) compared with the known cut-off level (mean+2 times SD) of 480 historical healthy controls.13 ,14 A second replication cohort, comprising 20 SSc patients and 20 controls, confirmed this observation of increased levels of S100A8/A9 in SSc (p=0.009). In line with the observations using SELDI-TOF, S100A8/A9 were not discriminative between lcSSc (529±41) and dcSSc (532±54) patients. Further analysis revealed that S100A8/A9 levels are specifically increased in lcSSc patients with lung fibrosis compared with those without (642±80 vs 426±27; p=0.008). In patients with dcSSc, S100A8/A9 levels were similar in those with or without lung fibrosis. Patients with antitopoisomerase I antibodies (ATA) show higher S100A8 levels than those being ATA negative unrelated to their disease subtype (676±70 vs 470±34; p=0.004) (figure 1C). Other clinical features were not correlated with S100A8/A9 levels.
Discussion
Besides the lack of effective therapy, the current biggest unmet need in clinical care for patients with systemic sclerosis is the absence of biomarkers predicting disease course and/or treatment response. Given the potential complex circuitry that leads to SSc itself or its heterogenic disease course, we chose to harness a non-hypothesis-driven approach to identify robust biomarkers for SSc disease clinical phenotype. Using two different methods, we robustly replicated S100A8/A9 as a molecule that is significantly increased in SSc patients and associated with lung fibrosis in those patients with lcSSc.
As S100A8/A9, also named calprotectin, MRP8/14 and calgranulin A/B, is considered as an endogenous ligand for TLR4, the role of TLRs in SSc and/or fibrosis is further substantiated by our data. TLR4 signalling in SSc patients was previously shown to induce transforming growth factor β responses in SSc tissues and cytokine by dendritic cells from SSc patients in a higher magnitude compared with that observed in healthy donors.15 ,16 Moreover, whereas TLR4 signalling was able to induce fibroblast proliferation and pulmonary fibrosis,17 inhibiting this pathway inhibited lung fibrosis induced by lipopolysaccharide.18 These observations advocate a role of TLR4 signalling in SSc and are in line with the observation that S100A8/A9 levels are increased in SSc and correlate with lung fibrosis in patients with lcSSc. The discrepancy between the correlation in patients with lcSSc versus dcSSc is however remarkable. Especially in the light of the recent publication showing S100A8/A9 being increased mainly in the dcSSc population, this might be explained due to differences between Asian and Caucasian populations or differences in inclusion criteria and/or technicalities of the ELISAs used.19 Earlier studies have shown an increase in SSc patient without making a subdivison.20 ,21 This study also showed a clear correlation with lung fibrosis as was previously suggested by Hesselstrand et al22 on bronchoalveolar lavage fluid in SSc. Perhaps this suggests that the etiopathogenesis of lung fibrosis in patients with lcSSc is different from that in patients with the diffuse clinical phenotype in different cohorts. The contribution of ATAs to the development of skin and lung fibrosis as suggested by Yoshizaki et al23 could partly explain these differences as it is correlated to S100A8/A9 levels. As potent type I interferon-producing cells, pDC gained interest in diseases such as systemic lupus erythematosus and SSc. A recent publication showed their capability of producing S100A8/A9.24 Furthermore, their activation by ATA is suggested before by Eloranta et al.25 These data show that pDCs might play a different role in different disease subtypes of SSc and different phases of the disease. In ATA-positive lcSSc patients, activation of pDC could play a part on the way towards lung fibrosis, an important complication and therefore an important hypothesis to pursue in further research.
Besides S100A8/A9, other candidate molecules such as the CXCL4 family found to be differentially expressed are of interest. CXCL4 was recently identified as a novel biomarker for SSc skin and lung fibrosis and correlated well with S100A8/A9 (see online supplementary figure S4).6 Whether S100A8/A9 is an additional biomarker useful for early detection of SSc risk remains to be investigated in bigger studies. Similarly, the observation that other inflammatory markers such as TNF-α and complement C1q are likely to be highly expressed in the circulation of SSc patients warrants further investigation as these molecules have been found to be implicated in a plethora or chronic inflammatory diseases. Further studies need to resolve whether a combination of these candidate molecules even further increase the potential to discriminate SSc phenotypes.
In conclusion, S100A8/A9 levels were increased in SSc patients and especially in lcSSc with lung fibrosis. This implies a role for S100A8/A9 as a biomarker for SSc lung fibrosis as well as a role for TLRs in this disease.
Acknowledgments
We thank Richard Huijbens, BSc, for his technical support on this paper.
References
Supplementary materials
Supplementary Data
This web only file has been produced by the BMJ Publishing Group from an electronic file supplied by the author(s) and has not been edited for content.
Files in this Data Supplement:
- Data supplement 1 - Online supplement
Footnotes
-
Handling editor Tore K Kvien
-
Contributors All authors listed have contributed sufficiently to the project to be included as authors, and all those who are qualified to be authors are listed in the author byline.
-
Funding The research was supported by the Dutch Arthritis Association (TRDJR and LvB). FG was supported by the FP7 grant EUTRAIN (EUropean Translational training for Autoimmunity & Immune manipulation Network), ref. 289903.
-
Competing interests None.
-
Ethics approval Local Ethics Committee Arnhem/Nijmegen.
-
Provenance and peer review Not commissioned; externally peer reviewed.